Band 6.0 IELTS Writing Task 1 Model Answer
Overall Band Score: 6.0 · IELTS Academic Practice Accelerator · 2026-11-06
IELTS Writing Task 1 question
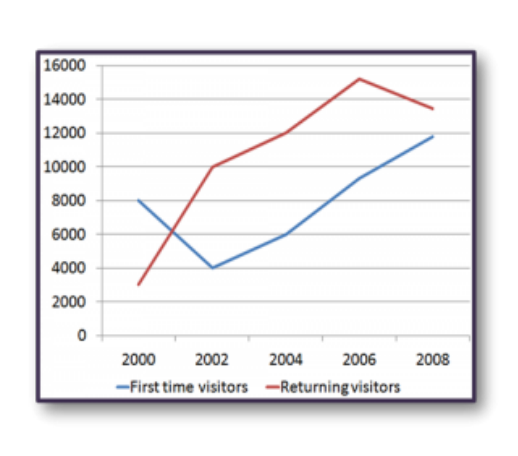
The line graph shows the number of first time visitors and returning visitors who visited Caryl Island from 2000 to 2008.
Summarise the information by selecting and reporting the main features, and make comparisons where relevant.
The line graph shows the number of first time visitors and returning visitors who visited Caryl Island from 2000 to 2008.
Student answer (Band 6.0)
The line graph illustrates the number of visitors who are visiting for the first time and returning to Caryl Island between 2000 to 2008.
Overall it is evident that the number of visitors in Caryl Island has increased throughout the year reaching its peak in 2006 with approximately 15,000 visitors,whereas the number of people visiting Caryl Island for the first time is shown signifiicantly less with lowest count being 4000 first timers in 2002.
The number of visitors who were visiting Caryl Island for the first time graudally started off around 8000 visitors in the year 2000,by 2002,a sharp decline is visible as it is lowest trend visible in the graph,accounting up to only 4000 new visitors in that year,graudally,a steady rise is visible throughout the years and the most number of first time visitors seen in this graph is approximately 12,000 new visitors.
Considering the number of visitors who are returning,the lowest spike visible accounts upto approximately 3000 visitors in the year 2000..Subsequently the trend increases with the highest number of returning visitors being approximately 16,000 in 2006,but towards 2008 there is a subtle decrease in the trend.
AI examiner evaluation
| Criterion | Band |
|---|---|
| Task Achievement / Task Response | 6.0 |
| Coherence and Cohesion | 6.5 |
| Lexical Resource | 5.5 |
| Grammatical Range and Accuracy | 5.5 |
| Overall | 6.0 |
Task Achievement / Task Response: Band 6.0
You cover both visitor groups and identify several key movements: first-time visitors fall from about 8,000 to 4,000 before rising to roughly 12,000, while returning visitors climb from around 3,000 to a peak in 2006 and then decline. However, the overview contains an important misreading: it says the overall number of visitors peaks in 2006 at approximately 15,000, although that figure refers only to returning visitors; the combined total is not shown as a series. The overview also does not clearly compare the groups across the period. Some details are imprecise, such as describing the first-time rise as steady despite the sharper increase after 2004. Make the overview focus on each series’ contrasting pattern and report the 2008 values more explicitly.
Coherence and Cohesion: Band 6.5
The response has a clear overall structure: an introduction, an overview, and separate paragraphs for first-time and returning visitors. This makes the two series easy to follow, and sequencing expressions such as “by 2002” and “Subsequently” help show change over time. The organisation is coherent, but some linking is mechanical or unclear. For example, “gradually” is repeated in the first-time paragraph, and the long sentence beginning “by 2002” joins several stages without clean punctuation. The overview’s reference to “the number of visitors” also makes it unclear whether you mean one series or the combined total. Use shorter, well-punctuated comparisons and clearer references to each visitor group to make progression more precise.
Lexical Resource: Band 5.5
You use a reasonable range of trend vocabulary, including “sharp decline,” “steady rise,” “peak,” and “subtle decrease,” which helps describe the graph. However, several choices are inaccurate or unnatural for formal data reporting. “Lowest spike” does not describe a low point, and “highest number … seen” is less precise than a direct statement that the figure reached a peak. There are also noticeable spelling errors, including “signifiicantly” and “graudally,” and phrases such as “visitors who are visiting” are repetitive. Aim for accurate collocations and concise wording, such as “the figure fell” or “the number of returning visitors reached a high.” Proofreading spelling and avoiding repeated forms will improve clarity and control.
Grammatical Range and Accuracy: Band 5.5
You attempt both simple and more complex sentence forms, including the contrast in “whereas” and the time sequence introduced by “by 2002.” The main trends remain understandable, but some grammatical and punctuation errors reduce accuracy. The opening says “between 2000 to 2008”; use “between 2000 and 2008.” In “the number of visitors in Caryl Island has increased throughout the year,” the time reference and tense do not fit the period shown, and “the number … is shown significantly less” is not a well-formed comparison. Several sentences run together after commas, while the returning-visitors paragraph ends with a double full stop. Practise accurate comparison structures and divide long sentences into complete clauses.
See this exact question answered at other band scores. The same prompt compared across bands.
Browse more IELTS Writing model answers or get your own writing scored by the same AI examiner.