Band 5.5 IELTS Writing Task 1 Model Answer
Overall Band Score: 5.5 · IELTS Academic Practice Accelerator · 2026-11-06
IELTS Writing Task 1 question
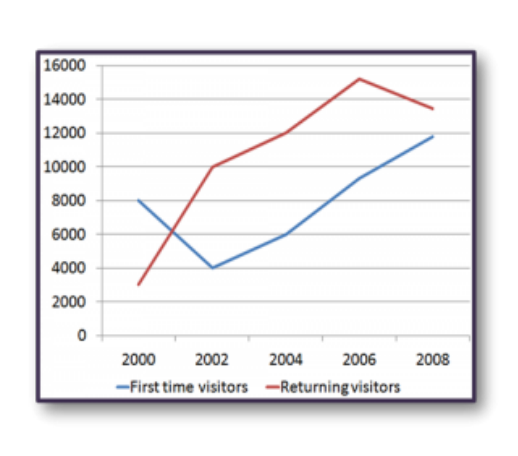
The line graph shows the number of first time visitors and returning visitors who visited Caryl Island from 2000 to 2008.
Summarise the information by selecting and reporting the main features, and make comparisons where relevant.
The line graph shows the number of first time visitors and returning visitors who visited Caryl Island from 2000 to 2008.
Student answer (Band 5.5)
The line graph illustrates the number of first time tourists and returning tourists who explored the Caryl Islam from 2000 to 2008.
Overall, returning visitors was the highest position and first visitors were the lowest position. But in the early first time visitors were the highest. While, returning tourists showed that it was increased sharply.
Looking at 2000, first time visitors were the highest the number 8000 and returning visitors number around 3000. Then in 2002, first time visitors dramatically decreased where the tourists number were 4000 but returning visitors experience increased and the number were 10000. In 2004, first time visitors and returning visitors slightly increased and the numbers were 6000 and 12000.
However, in 2006, first time tourists and returning tourists also rise slightly in Caryl Islam and the numbers were around 9000 and 15000. In 2008, it was the only year where returning visitors declined the number were around 13800 but first time visitors steadily increased the tourists numbers 12000.
AI examiner evaluation
| Criterion | Band |
|---|---|
| Task Achievement / Task Response | 6.0 |
| Coherence and Cohesion | 6.0 |
| Lexical Resource | 5.5 |
| Grammatical Range and Accuracy | 5.0 |
| Overall | 5.5 |
Task Achievement / Task Response: Band 6.0
You cover the full period and report the main movements for both visitor groups, including the sharp fall in first-time visitors in 2002, the rise in returning visitors to a peak in 2006, and their subsequent decline. Most figures are close to the chart, although the 2008 values are somewhat overstated. Your overview identifies returning visitors as generally higher, but “in the early first time visitors were the highest” is unclear and conflicts with the overall comparison: first-time visitors were higher only in 2000. The overview would be stronger if it clearly stated that both series rose overall, while returning visitors peaked in 2006 and first-time visitors ended at their highest point. Some comparisons are reported year by year rather than prioritised as the most significant features.
Coherence and Cohesion: Band 6.0
The response has a clear overall structure: an introduction, an overview, and two paragraphs describing the figures in chronological order. This makes the information reasonably easy to follow, and transitions such as “Then,” “However,” and “In 2008” help signal changes over time. However, some linking is mechanical or awkward, particularly “While, returning tourists showed that it was increased sharply,” and the contrast introduced by “However” in the final paragraph is not fully clear. References such as “it” in “it was the only year” are also vague. To improve progression, group the main trends more deliberately and use concise links that show whether figures rose, fell, or peaked.
Lexical Resource: Band 5.5
You use relevant vocabulary for describing a line graph, including “dramatically decreased,” “increased,” “declined,” and “steadily increased,” so the main trends can generally be understood. However, word choice and collocation are often imprecise or repetitive. “Caryl Islam” is an inaccurate name for the island, while “highest position” and “the tourists number” are not natural ways to describe data. “Explored” is also an unsuitable verb for people visiting a destination. Aim for precise graph language and avoid repeating “number” where “figure” or “total” would be more natural. Greater accuracy with these common expressions would make the description clearer and more fluent.
Grammatical Range and Accuracy: Band 5.0
You attempt a mixture of simple sentences and longer clauses, including comparisons across years, and the reader can usually understand the intended trends. However, errors in agreement, verb forms, articles, and sentence construction remain noticeable. For example, “returning visitors was” should use a plural verb, and “it was increased sharply” has an incorrect verb form. The sentence beginning “Looking at 2000” also lacks a clear grammatical structure around “were the highest the number 8000.” Some sentences join clauses awkwardly, as in “In 2008, it was the only year where returning visitors declined the number were around 13800.” Practise accurate comparison sentences and use full stops or conjunctions to separate complete clauses.
See this exact question answered at other band scores. The same prompt compared across bands.
Browse more IELTS Writing model answers or get your own writing scored by the same AI examiner.