Band 5.5 IELTS Writing Task 1 Model Answer
Overall Band Score: 5.5 · IELTS Academic Practice Accelerator · 2026-11-06
IELTS Writing Task 1 question
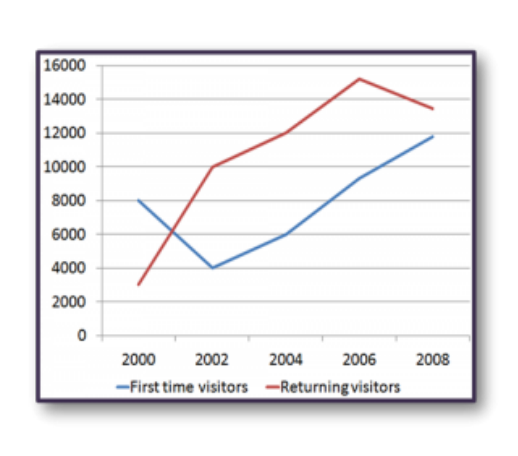
The line graph shows the number of first time visitors and returning visitors who visited Caryl Island from 2000 to 2008.
Summarise the information by selecting and reporting the main features, and make comparisons where relevant.
The line graph shows the number of first time visitors and returning visitors who visited Caryl Island from 2000 to 2008.
Student answer (Band 5.5)
The given graph shows the number of visitors that visited Caryl Island from 2000 to 2008. It consist the data of visitors of that 8 years. On vertical axis, number of visitors are illustrated while the years are written on horizontal axis. The graph consists two lines of different colours blue and red. The blue line refers to the graphical illustration of new visitors while the red line shows the returning visitors. In first two years from 2000 to 2002, the graph of new visitors continuously declining showing the reduction of new visitors. It might be happened due to the rejection of applications of new visitors by the government for specific reasons, the graph hits its lowest at 2002 and then started rising again and touched its peak at 2008. While on the other hand, when the new visitors graph was declining, the graph of returning visitors was continuously rising and touched its peak in 2006 and then started to decline.
AI examiner evaluation
| Criterion | Band |
|---|---|
| Task Achievement / Task Response | 5.5 |
| Coherence and Cohesion | 5.5 |
| Lexical Resource | 5.5 |
| Grammatical Range and Accuracy | 5.5 |
| Overall | 5.5 |
Task Achievement / Task Response: Band 5.5
You identify both visitor groups and describe their broad directions: first-time visitors fall to a low in 2002 before rising, while returning visitors increase to a high in 2006 and then decline. However, the account is only partial because it gives no figures and does not clearly compare the series at key points. For example, returning visitors were already higher in 2002 and remained ahead through 2008, while first-time visitors finished at about 11,800 and returning visitors at about 13,400. The claim that the first-time series “touched its peak at 2008” is broadly accurate, but the overview would be stronger if it also noted that returning visitors peaked higher. Avoid inventing a cause such as government rejection of applications; the graph provides no evidence for this.
Coherence and Cohesion: Band 5.5
The response follows a generally understandable order, moving from an introduction to the first-time visitor trend and then to returning visitors. Linking phrases such as “on the other hand” help signal a comparison, and the reader can follow the main changes. However, the opening spends several sentences describing the axes and colours rather than establishing the main overview, and the response is presented as one paragraph, so its progression is not clearly signposted. Some connections are also awkward: “when the new visitors graph was declining” does not accurately describe the whole period, since that series later rises. Organise the report into an introduction, a concise overview, and detail paragraphs, using comparisons at matching years to make the relationships clearer.
Lexical Resource: Band 5.5
You use relevant vocabulary for describing trends, including “declining,” “rising,” “lowest,” and “peak,” so the main movements are understandable. There is also some attempt to vary wording, for example “new visitors” and “returning visitors.” However, several expressions are repetitive or imprecise, such as “the graph shows,” “graphical illustration,” and “touched its peak.” “It might be happened due to the rejection” is an unsupported explanation and is also an unnatural phrase. More precise chart language would help you report the data rather than speculate about causes. Aim to use terms such as “fell,” “recovered,” “reached a high,” and “stood at,” while avoiding repeated references to the graph itself.
Grammatical Range and Accuracy: Band 5.5
You attempt both simple and longer sentences, and the overall meaning is usually recoverable. However, errors in agreement, articles, verb forms, and sentence construction are noticeable. For example, “It consist the data” should be “It presents data,” and “the graph consists two lines” needs “consists of two lines.” The phrase “It might be happened” has an incorrect verb form; use “This may have happened,” though in this task a cause should not be added. “The graph hits its lowest” also shifts tense and needs a more suitable construction, such as “reached its lowest point.” Practise accurate past-tense reporting and check subject–verb agreement and articles. Clearer sentence boundaries would also make the longer comparisons easier to read.
See this exact question answered at other band scores. The same prompt compared across bands.
Browse more IELTS Writing model answers or get your own writing scored by the same AI examiner.