Band 5.5 IELTS Writing Task 1 Model Answer
Overall Band Score: 5.5 · IELTS Academic Practice Accelerator · 2026-11-08
IELTS Writing Task 1 question
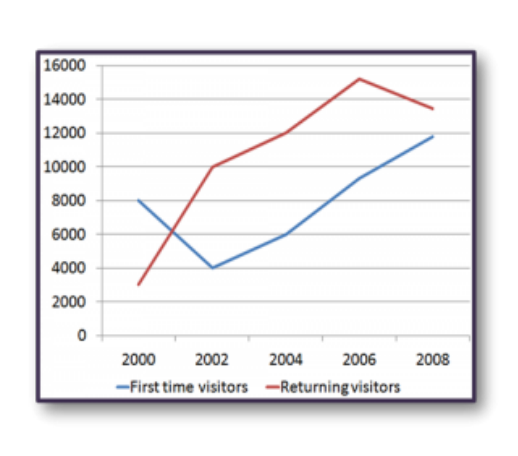
The line graph shows the number of first time visitors and returning visitors who visited Caryl Island from 2000 to 2008.
Summarise the information by selecting and reporting the main features, and make comparisons where relevant.
The line graph shows the number of first time visitors and returning visitors who visited Caryl Island from 2000 to 2008.
Student answer (Band 5.5)
The number of first time travelers and the travelers who had returned are illustrating in the given line graph between the year 2000 and 2008.
Overall, it is clearly visible that, in the year 2002 had recorded the lowest number of visitors as per first time visitors. And for the returning visitors it peaked in the year 2006.
In the year 2000, the first time visitors were in numbers 8000. For the returning visitors it recorded in the number 3000. The number of all remained almost 5000. Future visit of the year 2002 had dropped significantly into 4000 for the first time travelers, but it increased for the retutrning visitors into 10,000. In the year, 2004 the first time travelers had slightly increased, as well as for the returning visitors. 2006 had mentioned the dramatic highest amount of increase as for the returning vivitors into almost 15,000. And first time vivistoirs into 10,000. The year 2008, had recorded the highest in n umber for the first time visitors in the number 12,000. Following the number of returning visitors decreased into 13,000.
AI examiner evaluation
| Criterion | Band |
|---|---|
| Task Achievement / Task Response | 6.0 |
| Coherence and Cohesion | 6.0 |
| Lexical Resource | 5.0 |
| Grammatical Range and Accuracy | 5.0 |
| Overall | 5.5 |
Task Achievement / Task Response: Band 6.0
You cover both visitor groups across the full period and identify important patterns: first-time visitors fall to a low in 2002 before rising, while returning visitors reach their peak in 2006 and then decline. Most figures are broadly consistent with the graph, including the starting values and the 2002 figures. However, the overview says 2002 had the lowest number of visitors, which is unclear because it was only the low point for first-time visitors; returning visitors rose then. Some details are also imprecise: first-time visitors were about 9,300 in 2006, not 10,000, and returning visitors ended at about 13,400. Clarify the overall comparison and report key values more accurately to make the summary more complete.
Coherence and Cohesion: Band 6.0
The response has a recognisable structure: an introduction, an overview, and a chronological account of the figures. This gives the reader a general route through the information, and time markers such as “In the year 2000” and “The year 2008” help signal changes. However, the overview is not clearly separated from the details in its meaning, and several transitions are awkward or unclear, such as “The number of all remained almost 5000” and “Following the number of returning visitors decreased.” The account also relies heavily on repeated year-by-year openings rather than grouping the two series to show comparisons. Use clearer linking and reference, and organise the body around the main trends or contrasting movements.
Lexical Resource: Band 5.0
You use some task-relevant vocabulary, including “peaked,” “dropped significantly,” “increased,” and “decreased,” which helps describe movement in the graph. However, the range is limited and several choices or collocations are inaccurate, making parts of the report difficult to interpret. For example, “The number of all remained almost 5000” does not clearly express what is being counted, while “had mentioned the dramatic highest amount of increase” is not a natural way to describe a peak. There are also spelling errors such as “retutrning,” “vivitors,” and “vivistoirs.” Build a more precise set of trend phrases and check spelling, especially for repeated key terms.
Grammatical Range and Accuracy: Band 5.0
You attempt both simple statements and longer sentences, and the reader can usually follow the broad sequence of changes. However, some sentence structures and verb forms are inaccurate, and these sometimes obscure the intended meaning. For instance, “are illustrating in the given line graph” is not a correct construction, and “In the year 2000, the first time visitors were in numbers 8000” has an awkward sentence pattern. The overview phrase “in the year 2002 had recorded” also lacks a clear grammatical subject. Work on forming complete subject–verb sentences and using consistent past-tense reporting, for example, “The number of first-time visitors stood at 8,000 in 2000.” More accurate sentence patterns will make your comparisons easier to understand.
See this exact question answered at other band scores. The same prompt compared across bands.
Browse more IELTS Writing model answers or get your own writing scored by the same AI examiner.