Band 4.5 IELTS Writing Task 1 Model Answer
Overall Band Score: 4.5 · IELTS Academic Practice Accelerator · 2026-11-08
IELTS Writing Task 1 question
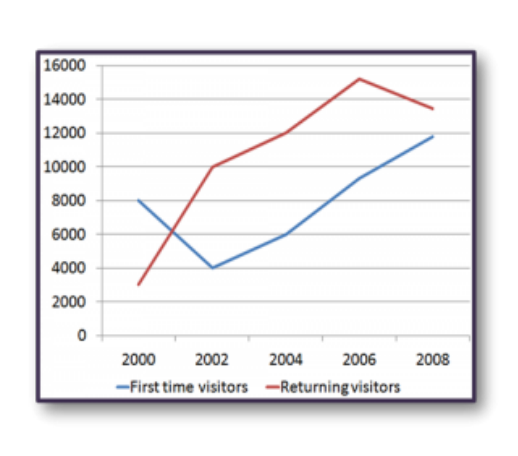
The line graph shows the number of first time visitors and returning visitors who visited Caryl Island from 2000 to 2008.
Summarise the information by selecting and reporting the main features, and make comparisons where relevant.
The line graph shows the number of first time visitors and returning visitors who visited Caryl Island from 2000 to 2008.
Student answer (Band 4.5)
"The line graph shown different returing visitors who visited Carly Island from 2000 to 2008.According to 2000 the first time visitors are 4000.On 2002 the first time visitors on visited Carly island are 6000,On [redacted phone] and finally on 2008 approxiamtely 12,000.On the other Hand,the returning visitors on 2000 its 0,no returing visitors are seen initally,then on 2002 the first time visitors are 4,000.On 2004 6,000.On 2006 the caryl island are 8,000 then increased graudally till 10,000 carly island and finally on 2008 it is a approximately 15000 respectively.The dominant value are according to 2008 which are 15,000 and after this some values on 2008 of carly island are decreased respectively.Conseuqeuntly,these are the two different graphs which are shown first time visitors and returing visitors.These are the changes which were shows the different visitors who visited caryl island.Before these changes would not developed,but after some times the difference between first time visitors and returng visitors are shown."
AI examiner evaluation
| Criterion | Band |
|---|---|
| Task Achievement / Task Response | 3.5 |
| Coherence and Cohesion | 4.0 |
| Lexical Resource | 5.0 |
| Grammatical Range and Accuracy | 4.5 |
| Overall | 4.5 |
Task Achievement / Task Response: Band 3.5
The response attempts to describe both visitor groups and includes several years, but the main figures and trends are repeatedly misreported. For example, first-time visitors are given as 4,000 in 2000 and 6,000 in 2002, whereas the graph shows about 8,000 and 4,000 respectively. Returning visitors are described as starting at zero, although they begin at about 3,000, and the later figures are also inaccurate. The overview is unclear: the claim that the dominant value is 15,000 in 2008 does not match the graph, where returning visitors peak at about 15,200 in 2006 before falling. To improve, identify the overall rise and the contrasting peak-and-decline pattern, then support these with accurate key figures.
Coherence and Cohesion: Band 4.0
There is some attempt to move through the years in sequence and to distinguish the two visitor groups, using phrases such as “On the other hand” and “finally.” However, the response is presented as one continuous paragraph, and the repeated year-by-year statements do not build a clear comparison or overall progression. References such as “these changes” and “these are the two different graphs” are vague, while several ideas are repeated at the end without adding information. Organise the report into a brief overview and separate details for each series, or compare both series across the same periods. Use linking expressions only where they clarify a real contrast or change.
Lexical Resource: Band 5.0
The response uses a small range of task-related vocabulary, including “first time visitors,” “returning visitors,” “increased,” and “decreased,” so the topic is generally identifiable. However, word choice and spelling errors are frequent enough to make parts difficult to follow: “returing,” “graudally,” and “Conseuqeuntly” are examples. Some expressions are also unnatural or imprecise, such as “the dominant value” and “the graphs which are shown,” since the task presents two lines on one graph. Build a more accurate set of trend and comparison phrases, and check spelling carefully. Terms such as “rose,” “peaked,” “declined,” and “approximately” would help describe the data more precisely.
Grammatical Range and Accuracy: Band 4.5
The writing relies mainly on short, simple statements, with limited control of sentence structure. Some attempts to connect clauses are present, but they often produce incomplete or confusing sentences, as in “On the 2006 the caryl island are 8,000 then increased gradually till 10,000.” Verb forms and agreement are also inconsistent: “The line graph shown” and “the first time visitors are 4000” do not form accurate descriptions of past data. Punctuation is weak, with missing spaces after full stops and commas joining statements that should be separated. Practise past-tense reporting structures such as “The figure rose to…” and form complete sentences with a clear subject and verb.
See this exact question answered at other band scores. The same prompt compared across bands.
Browse more IELTS Writing model answers or get your own writing scored by the same AI examiner.