Band 5.5 IELTS Writing Task 1 Model Answer
Overall Band Score: 5.5 · IELTS Academic Practice Accelerator · 2026-11-08
IELTS Writing Task 1 question
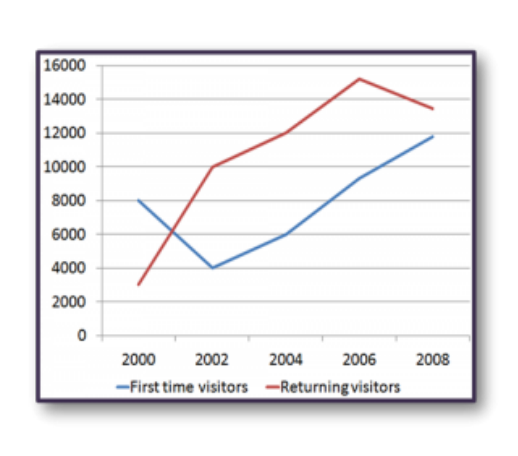
The line graph shows the number of first time visitors and returning visitors who visited Caryl Island from 2000 to 2008.
Summarise the information by selecting and reporting the main features, and make comparisons where relevant.
The line graph shows the number of first time visitors and returning visitors who visited Caryl Island from 2000 to 2008.
Student answer (Band 5.5)
The Given line graph illustrartes the quantity of Visitors entering first time and leaving the Caryl Island and their increase quantity over the 8 years of time .
Overall, It is obvious and clear that, returning visitors were large in numbers as compared to those who were entering first time.
By looking the graph further, we understand that, around 15000 visitors return from island in 2006, On the other hand 12000 visitors were visited first time in 2008 whereas, 4000 visitors visits the island in 2002 but only the 3000 visitors leaving the island in 2000.
In addition, Visitors quantity show decline from 2000 to 2002 and then increse further on the other hand the returning visitors showed upscaling throught the period.
AI examiner evaluation
| Criterion | Band |
|---|---|
| Task Achievement / Task Response | 5.5 |
| Coherence and Cohesion | 5.5 |
| Lexical Resource | 5.0 |
| Grammatical Range and Accuracy | 5.0 |
| Overall | 5.5 |
Task Achievement / Task Response: Band 5.5
You identify the main comparison—that returning visitors generally outnumbered first-time visitors—and include several relevant figures, such as about 15,000 returning visitors in 2006 and 4,000 first-time visitors in 2002. However, some figures are inaccurate: the 2006 returning total is about 15,200, and first-time visitors in 2008 were about 11,800, not 12,000 (a reasonable approximation). More importantly, the overview says visitor numbers declined from 2000 to 2002 without clearly distinguishing the two groups: first-time visitors fell, while returning visitors rose sharply. The response also does not meet the 150-word minimum, limiting how fully you can summarise and compare the data. Include both series’ overall patterns and clarify their contrasting movements.
Coherence and Cohesion: Band 5.5
There is a basic overall structure: an introduction, an overview, and further details. The comparison signalled by “On the other hand” is useful, and the response broadly moves from general information to figures. However, the progression is difficult to follow because several trends and years are crowded into one long sentence, and the final sentence repeats information without clearly separating the two visitor groups. Linking phrases such as “By looking the graph further” and “In addition” do not always show the relationship between the ideas that follow. Organise the details into clearer stages—for example, describe first-time visitors together, then returning visitors—and use precise links such as “By contrast” when their trends differ.
Lexical Resource: Band 5.0
You use some relevant task vocabulary, including “returning visitors,” “first time,” “decline,” and “increase,” so the topic is generally understandable. However, the range is limited and several choices or combinations are unnatural, such as “quantity of Visitors,” “visitors return from island,” and “showed upscaling.” Spelling errors, including “illustrartes,” “increse,” and “throught,” also reduce accuracy. Prefer standard chart language and use it consistently: describe the number of visitors as rising, falling, peaking, or recovering, rather than using “quantity” or “upscaling.” Check spelling and choose natural collocations so the reader can focus on the data rather than interpreting the wording.
Grammatical Range and Accuracy: Band 5.0
The response attempts some longer sentence forms, including a contrast introduced by “On the other hand,” but control is inconsistent. Errors in sentence structure and punctuation make parts difficult to read: the sentence beginning “By looking the graph further” runs several comparisons together, with commas and capital letters used unpredictably. There are also problems with articles, prepositions, and verb forms, as in “the Caryl Island,” “By looking the graph,” and “4000 visitors visits.” Most sentences rely on simple patterns, and the attempted complex sentence is not reliably controlled. Build shorter, complete sentences first, then add one clear subordinate or contrast clause at a time; check subject–verb agreement and sentence boundaries.
See this exact question answered at other band scores. The same prompt compared across bands.
Browse more IELTS Writing model answers or get your own writing scored by the same AI examiner.