Band 5.5 IELTS Writing Task 1 Model Answer
Overall Band Score: 5.5 · IELTS Academic Practice Accelerator · 2026-11-09
IELTS Writing Task 1 question
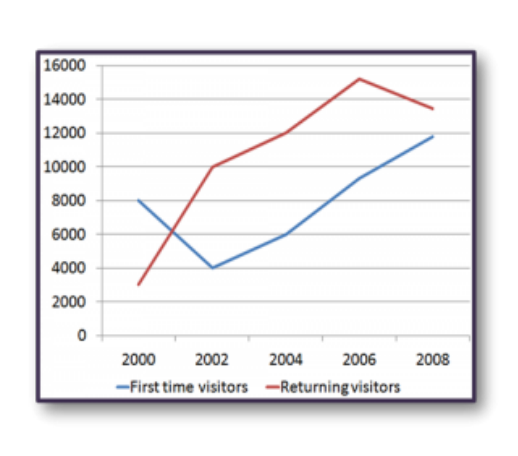
The line graph shows the number of first time visitors and returning visitors who visited Caryl Island from 2000 to 2008.
Summarise the information by selecting and reporting the main features, and make comparisons where relevant.
The line graph shows the number of first time visitors and returning visitors who visited Caryl Island from 2000 to 2008.
Student answer (Band 5.5)
The graph lines displays the number of first time visitors and the number of returning visitors who visted Caryl Island form 2000 to 2008. The blue line shows the number of first time vistors and the Itbrown line shows the returing vistors .
On the very begining , means in 2000 number of new visitors or first time visitors was more then the number of returning visitors . But with the passage of time there was a large descrease in the first time visitors and as it came to 4000 from 8000 in 2002 . Inspite of that the there was a greate increase in the number of returing visitors from 2000 to 10000 in 2002 . After a big downfall in the number of first time visistors it again started growing in 2002 and reach at 6000 in 2004 . With that the number of returing people also kept inceasing as well . The first time visitos after the 2002 kept increasing and by the end of 2008 it reached 12000 by cantinously increaing every year . But the number of returning visitors got a slight decrease in the start of 2006 and in 2008 it ends up as it was just less then 14000
AI examiner evaluation
| Criterion | Band |
|---|---|
| Task Achievement / Task Response | 5.5 |
| Coherence and Cohesion | 5.5 |
| Lexical Resource | 5.0 |
| Grammatical Range and Accuracy | 5.0 |
| Overall | 5.5 |
Task Achievement / Task Response: Band 5.5
You identify both visitor groups and report several key movements, including the fall in first-time visitors from 8,000 to 4,000 in 2002 and the rise in returning visitors to 10,000. You also note that first-time numbers recover and that returning visitors decline slightly towards the end. However, the response lacks a clear overview of the main pattern: returning visitors generally outnumbered first-time visitors after 2000 and peaked in 2006, while first-time visitors rose steadily after 2002. Some details are imprecise or misleading: returning visitors did not begin declining until after 2006, and the graph gives approximate values of about 11,800 and 13,400 in 2008. A concise overview and more accurate comparisons would make the report more complete.
Coherence and Cohesion: Band 5.5
The response follows the timeline from 2000 to 2008, so the reader can trace the main changes, and phrases such as “with the passage of time” and “by the end of 2008” provide some signposting. However, the information is presented in one long body paragraph after a brief introduction, with no distinct overview to guide the reader. Several transitions are repetitive or awkward, particularly the repeated use of “But” and “With that,” and the sequence sometimes circles back to earlier years rather than grouping the two series clearly. For example, the account moves from 2002 to 2004 and then back to the trend after 2002. Organise the report into an introduction, overview, and two focused detail paragraphs, using clearer links between comparisons.
Lexical Resource: Band 5.0
You use some relevant vocabulary for describing trends, including “increase,” “decrease,” “growing,” and “slight decrease,” and the reader can generally understand which visitor group you mean. However, the range is limited and several expressions are inaccurate or unnatural, such as “a big downfall,” “kept increasing as well,” and “ends up as it was just less then 14000.” Repeated references to “number of” and “visitors” also make the report less precise. Spelling errors are frequent, including “visted,” “returing,” “visistors,” and “cantinously,” which distract from the information. Practise accurate trend collocations and use a wider set of terms such as “fell,” “recovered,” “rose steadily,” and “peaked.”
Grammatical Range and Accuracy: Band 5.0
You attempt to connect ideas in longer sentences, for example, “After a big downfall … it again started growing in 2002 and reach at 6000 in 2004.” However, these attempts often contain errors, and most sentence patterns are simple or joined with basic connectors. Problems include subject–verb agreement in “The graph lines displays,” incorrect verb forms in “it … reach,” and faulty sentence construction in “On the very begining, means in 2000 number …”. Articles and punctuation are also inconsistent, as in “the there was” and the spaces before full stops. These errors sometimes make relationships between events difficult to follow. Build accuracy first with clear past-tense sentences, then combine them using correctly formed clauses and consistent punctuation.
See this exact question answered at other band scores. The same prompt compared across bands.
Browse more IELTS Writing model answers or get your own writing scored by the same AI examiner.