Band 5.5 IELTS Writing Task 1 Model Answer
Overall Band Score: 5.5 · IELTS Academic Practice Accelerator · 2026-11-10
IELTS Writing Task 1 question
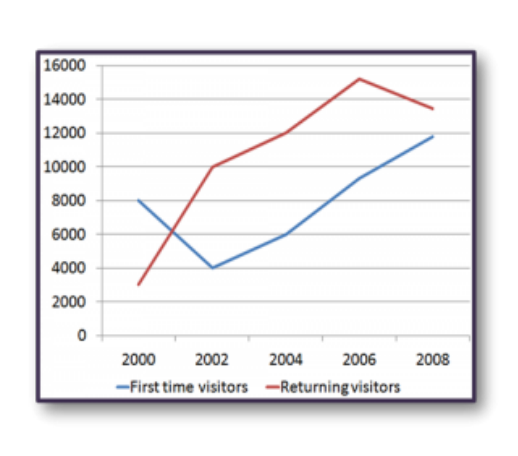
The line graph shows the number of first time visitors and returning visitors who visited Caryl Island from 2000 to 2008.
Summarise the information by selecting and reporting the main features, and make comparisons where relevant.
The line graph shows the number of first time visitors and returning visitors who visited Caryl Island from 2000 to 2008.
Student answer (Band 5.5)
the line graph show us the number of the first visitors and the return visitors who visited caryl island from the year of 2000 to 2008
so the bleu line show us the first time visitors and it was there 8000 people in the year 2000 then the number of the visitors did low to 4000 in the year of 2002
while in the same period we see increase in the number of the return people wich is in the red line the in crease start with 3000 in the year of 2000 till get 10000 in the year of 2002
after that the number of the first visitors keep in crease till get the peak in the year of 2008 with 12000 people while the return visitors keep also increase till the peak with 15000 people in the year of 2006 then get down till 13000 in the year of 2008
AI examiner evaluation
| Criterion | Band |
|---|---|
| Task Achievement / Task Response | 5.5 |
| Coherence and Cohesion | 5.5 |
| Lexical Resource | 5.0 |
| Grammatical Range and Accuracy | 5.0 |
| Overall | 5.5 |
Task Achievement / Task Response: Band 5.5
You identify both visitor groups and report several key figures accurately: first-time visitors fall from 8,000 to 4,000, then rise to about 12,000, while returning visitors climb from 3,000 to a peak of roughly 15,000 before declining. However, the response does not give a clear overall summary of the main pattern, such as the returning group being larger for most of the period and ending above the first-time group. Some trends are also compressed: the first-time series rises after 2002, but the intermediate figures are omitted, and the comparison between the groups is not developed. A concise overview and clearer comparisons would make the report more complete and focused.
Coherence and Cohesion: Band 5.5
The response follows the graph chronologically and uses basic linking expressions such as “while” and “after that,” so the reader can generally follow the changes. However, it is presented as one continuous block rather than being organised into a clear introduction, overview and detail paragraphs. The repeated pattern of describing one line and then the other also makes the progression feel mechanical, and “after that” does not clearly signal which period or series is being discussed. Use paragraphing to separate the overview from the figures, and connect the two series through direct comparisons at key years. This would create a clearer overall progression and make references easier to follow.
Lexical Resource: Band 5.0
You use some relevant graph vocabulary, including “visitors,” “increase,” “peak” and “down,” and the main trends are usually understandable. However, the range is limited and several choices or spellings are inaccurate, such as “return people,” “did low,” “keep in crease” and “get down.” These expressions are either unnatural or imprecise for describing data, and repeated use of “number” and “visitors” makes the account less varied. Aim for accurate trend language and standard spelling, for example “declined,” “rose steadily,” “returning visitors” and “reached a peak.” More precise vocabulary would help you describe changes and comparisons clearly.
Grammatical Range and Accuracy: Band 5.0
The response attempts to connect ideas in longer sentences, for example with “while” and “then,” but most sentence patterns are simple or joined together without reliable punctuation. There are frequent errors in verb forms and agreement: “the line graph show us,” “the number … did low,” and “the first visitors keep in crease” do not use accurate grammatical forms. Articles and sentence boundaries are also inconsistent, as in “the in crease start with 3000 … till get 10000.” These errors sometimes make the relationships between events harder to read. Practise forming complete sentences with a clear subject and verb, and use past-tense forms such as “fell,” “increased” and “reached” consistently.
See this exact question answered at other band scores. The same prompt compared across bands.
Browse more IELTS Writing model answers or get your own writing scored by the same AI examiner.