Band 4.5 IELTS Writing Task 1 Model Answer
Overall Band Score: 4.5 · IELTS Academic Practice Accelerator · 2026-11-11
IELTS Writing Task 1 question
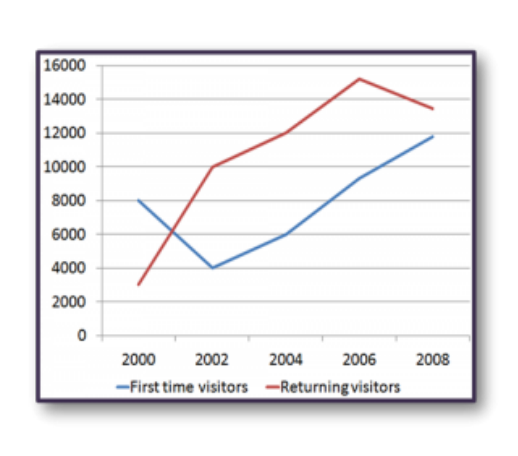
The line graph shows the number of first time visitors and returning visitors who visited Caryl Island from 2000 to 2008.
Summarise the information by selecting and reporting the main features, and make comparisons where relevant.
The line graph shows the number of first time visitors and returning visitors who visited Caryl Island from 2000 to 2008.
Student answer (Band 4.5)
The line graph illustrates the number of first time visitors and returning visitors who visited Caryl Island between 2000 and 2008.
Overall, we see a two categories first is First time visitors and second is Returning visitors and the visitors show the numbers of increasing and decreasing in 2000 and 2008.
Body 1:
In 2000 we see first time visitors number 8000 and after few time letar in 2002, the number of the first time visitore 4000, decrease after few time the line up and in 2004 , 2006 and 2008, same the line graph increase.
Body 2:
We see a red line he introduce returning visitors. In 2000, returning visitor number almost 3000, but few time exceeding a belw line and the line increase in 2002, the number of the returning visitors 10000, and 2004, he was increase 12000, and 2006, returning visitors stop and the number of the returning visitors almost 15000, but in 2008 the number of the returning visitors decrease almost 13000, in 2008.
AI examiner evaluation
| Criterion | Band |
|---|---|
| Task Achievement / Task Response | 5.0 |
| Coherence and Cohesion | 4.5 |
| Lexical Resource | 4.5 |
| Grammatical Range and Accuracy | 4.5 |
| Overall | 4.5 |
Task Achievement / Task Response: Band 5.0
You identify both visitor groups and report several key figures accurately, including 8,000 first-time visitors in 2000 and the returning-visitor rise to about 15,000 in 2006. However, the overview is unclear and does not summarise the main pattern: first-time visitors fell before recovering, while returning visitors rose to a peak and then declined. Some details are also imprecise or incomplete; for example, the first-time figures after 2002 are described only as increasing, and the final returning figure is given as about 13,000 rather than approximately 13,400. The response therefore covers the graph only partially, with limited development of its main comparisons. State the overall trends clearly, then support them with selected figures and direct comparisons.
Coherence and Cohesion: Band 4.5
The response has a basic structure: an introduction, an overview, and separate paragraphs for the two visitor groups. This gives the reader some sense of how the information is organised. However, progression within the body paragraphs is often difficult to follow, and several links are unclear or repetitive. Phrases such as “after few time” and “and 2004, 2006 and 2008” do not clearly show the sequence or relationship between the data points. The overview also repeats the idea of increasing and decreasing without specifying which group follows each trend. Use clear time markers such as “by 2002,” “thereafter,” and “before falling,” and organise each paragraph around a coherent trend rather than a series of loosely connected observations.
Lexical Resource: Band 4.5
You use some relevant task vocabulary, including “visitors,” “number,” “increase,” and “decrease,” so the general subject is understandable. However, the range is limited and several expressions are inaccurate or awkward, which sometimes makes the description harder to interpret. For example, “the visitors show the numbers of increasing and decreasing” is not a natural way to describe a graph, while “the line up” and “he introduce returning visitors” do not communicate the intended trends clearly. Spelling errors such as “letar” and “visitore” also reduce accuracy. Build a small set of precise graph-description phrases and use them consistently, such as “the figure fell,” “rose steadily,” “reached a peak,” and “declined to.”
Grammatical Range and Accuracy: Band 4.5
You attempt to describe changes over time and use some longer sentences, but the grammatical control is limited, and errors occur frequently enough to make parts of the account difficult to follow. For instance, “we see a two categories” has incorrect agreement, and “the number of the returning visitors 10000” is missing a verb. Tense and sentence construction are also inconsistent in phrases such as “he was increase 12000” and “the line increase in 2002.” Punctuation and sentence boundaries need attention, particularly in the long final paragraph, where several ideas run together. Practise forming accurate past-tense sentences with a clear subject and verb, for example, “The number rose to 12,000 in 2004.”
See this exact question answered at other band scores. The same prompt compared across bands.
Browse more IELTS Writing model answers or get your own writing scored by the same AI examiner.