Band 5.5 IELTS Writing Task 1 Model Answer
Overall Band Score: 5.5 · IELTS Academic Practice Accelerator · 2026-11-12
IELTS Writing Task 1 question
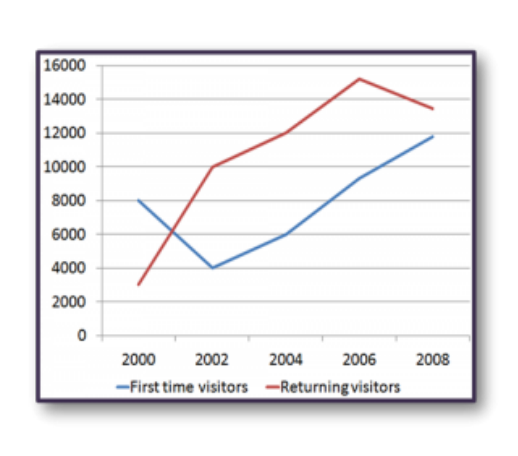
The line graph shows the number of first time visitors and returning visitors who visited Caryl Island from 2000 to 2008.
Summarise the information by selecting and reporting the main features, and make comparisons where relevant.
The line graph shows the number of first time visitors and returning visitors who visited Caryl Island from 2000 to 2008.
Student answer (Band 5.5)
The line graph shows the number of first time visitors and returning visitors who visited Caryl Island from 2000 to 2008.
overall, returning visitors were high then first time visitors for most of the period,expect in 2000.while first time visitors first decreased and then increased returning visitors rose until 2006 before falling slightly.
In 2000,there were 8,000 first time visitors.this number of fell sharply to 4,000 in 2002,which was the lowest points.After that increased steadily to 6,000 in 2004 ,9,000 in 2006,and in fanilly reached 12,000 in 2008.
Returning visitors started only 2000,in 2000. However, they increase to 10,000 in 2002 in 12,000 to 2004.They reached, peak of 15,000 in 2006,before dropping slightly to 13,000 in 2000,
AI examiner evaluation
| Criterion | Band |
|---|---|
| Task Achievement / Task Response | 5.0 |
| Coherence and Cohesion | 6.0 |
| Lexical Resource | 5.5 |
| Grammatical Range and Accuracy | 5.0 |
| Overall | 5.5 |
Task Achievement / Task Response: Band 5.0
You identify both visitor groups and report the main overall pattern: returning visitors were generally more numerous, while first-time visitors fell and then rose. Several figures are broadly accurate, including the first-time low of 4,000 in 2002 and the returning-visitor peak around 15,000 in 2006. However, the final year for returning visitors is incorrectly given as 2000 rather than 2008, and the opening comparison is unclear because first-time visitors were higher in 2000. The response also ends without a clear concluding comparison and is under-developed. It contains 96 words, below the required 150, which limits how fully the key features can be reported. Add a concise overview and complete, accurate comparisons across the period.
Coherence and Cohesion: Band 6.0
The response has a recognisable structure: an introduction, an overview, and separate paragraphs for the two visitor groups. This makes the main information reasonably easy to follow. You also use basic linking expressions such as “After that” and “before,” which help show sequence. However, some connections are awkward or unclear, particularly “However, they increase to 10,000 in 2002 in 12,000 to 2004,” and the final returning-visitor figure is attached to the wrong year, disrupting the progression. Punctuation and spacing also make the flow less smooth. To improve, organise each trend in a clear chronological sequence and use accurate links to compare the groups, rather than relying mainly on time markers.
Lexical Resource: Band 5.5
You use relevant vocabulary for describing a line graph, including “fell sharply,” “increased steadily,” “reached,” and “peak.” These choices communicate the broad movements and show some range beyond repeating “went up” or “went down.” However, several word-choice, collocation, and spelling problems reduce precision: “first decreased,” “number of fell,” “lowest points,” and “in fanilly” are not natural or accurate forms. “Started only 2000” also does not clearly express the starting value. Aim for standard graph language and check spelling and word forms carefully. More precise phrases such as “declined to a low of” and “rose to a peak of” would make the trends clearer and more formal.
Grammatical Range and Accuracy: Band 5.0
You attempt both simple statements and longer sentences with time clauses, for example, “After that increased steadily to 6,000 in 2004…” and “They reached, peak of 15,000 in 2006, before dropping…” This shows an effort to connect events rather than listing every figure separately. However, the longer constructions are often faulty, and several sentences lack a clear subject or have incorrect verb forms. Examples include “After that increased steadily,” “they increase to 10,000,” and “this number of fell sharply.” Articles and punctuation are also inconsistent, as in “reached, peak.” Use complete subject–verb sentences, maintain past tense for the historical data, and check articles and sentence boundaries.
See this exact question answered at other band scores. The same prompt compared across bands.
Browse more IELTS Writing model answers or get your own writing scored by the same AI examiner.