Band 5.5 IELTS Writing Task 1 Model Answer
Overall Band Score: 5.5 · IELTS Academic Practice Accelerator · 2026-11-12
IELTS Writing Task 1 question
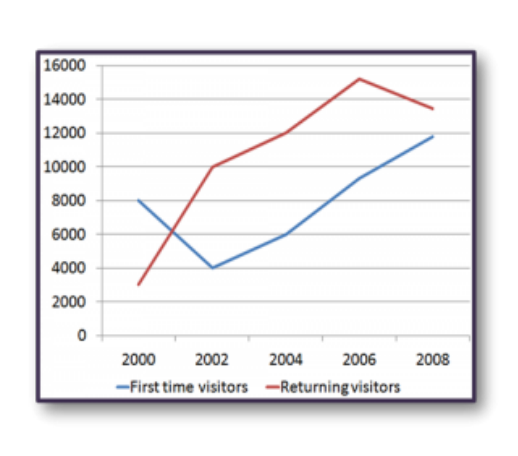
The line graph shows the number of first time visitors and returning visitors who visited Caryl Island from 2000 to 2008.
Summarise the information by selecting and reporting the main features, and make comparisons where relevant.
The line graph shows the number of first time visitors and returning visitors who visited Caryl Island from 2000 to 2008.
Student answer (Band 5.5)
The given line graph illustrates the amount of tourists and returning tourists who visited Caryl Island between the period of 2000 and 2008. It can be perceived by the looking at the graph that the numbe of returning visitors showed a upward trend and first time visitors showed flactuation.
In the year 2000, about 8000 indivduals visited the Caryl Island. After that In 2001, the amount of first time visitors and second time visitors were the same and were about 6000 people.
In 2002, the amount of returning visitors went up and stood at 10000. On the other hand the amount of first time visitors were the least and dropped at 4000.
After that, both first time and returning visitors grew up in number moderately. In the final year 2008, they both stood at 13000 and 12000 in number.
Overall, the amount of first time and second time visitors fluctuated through the given time period.
AI examiner evaluation
| Criterion | Band |
|---|---|
| Task Achievement / Task Response | 5.0 |
| Coherence and Cohesion | 6.0 |
| Lexical Resource | 5.5 |
| Grammatical Range and Accuracy | 5.5 |
| Overall | 5.5 |
Task Achievement / Task Response: Band 5.0
You identify the two visitor groups and include some relevant figures, such as first-time visitors falling to 4,000 in 2002 and returning visitors reaching 10,000. However, the account only partially captures the graph’s main features. The overview says returning visitors showed an upward trend, but this misses their peak of about 15,200 in 2006 and subsequent decline; the final comparison is also inaccurate, as the figures were approximately 13,400 returning and 11,800 first-time visitors, not 13,000 and 12,000. The reference to 2001 is unsupported because the graph gives data at two-year intervals. Develop a clearer overview of the contrasting trends and report the key turning points accurately.
Coherence and Cohesion: Band 6.0
The response has a recognisable structure: an introduction and overview are followed by paragraphs describing selected years, with time markers such as “In 2002” and “After that” helping the reader follow the account. This gives the information a generally coherent arrangement. However, the progression is not fully clear because the discussion jumps to 2001, a year not shown, and then moves between individual figures without consistently comparing the two series. The final “Overall” statement repeats an earlier generalisation rather than drawing the main trends together. Organise the body around the key stages or compare both visitor groups at each plotted year, and use referencing that makes clear which group each figure describes.
Lexical Resource: Band 5.5
You use relevant vocabulary for describing data, including “visitors,” “stood at,” “went up,” and “dropped,” so the topic remains understandable. However, the range of precise trend language is limited, and several choices are inaccurate or awkward: “grew up in number moderately” is not a natural collocation, while “amount of visitors” is less suitable than a count-based expression. There are also noticeable spelling errors, including “numbe,” “indivduals,” and “flactuation.” These reduce the accuracy and polish of the report, even though the intended meaning is usually recoverable. Build a small set of accurate terms for rises, falls, peaks, and comparisons, and check spelling and collocations during revision.
Grammatical Range and Accuracy: Band 5.5
You attempt both simple and more complex sentence forms, for example, “On the other hand the amount of first time visitors were the least and dropped at 4000.” The meaning is generally understandable, but some errors in agreement, articles, and sentence construction remain. In “the amount of first time visitors were,” the singular subject “amount” does not agree with “were”; “the looking at the graph” also has an incorrect article and construction. The opening sentence contains an awkward time expression, “between the period of 2000 and 2008,” and capitalisation after “After that” is inconsistent. Use direct, controlled structures such as “The number of first-time visitors fell to 4,000,” then check subject–verb agreement and articles.
See this exact question answered at other band scores. The same prompt compared across bands.
Browse more IELTS Writing model answers or get your own writing scored by the same AI examiner.