Band 5.5 IELTS Writing Task 1 Model Answer
Overall Band Score: 5.5 · IELTS Academic Practice Accelerator · 2026-11-13
IELTS Writing Task 1 question
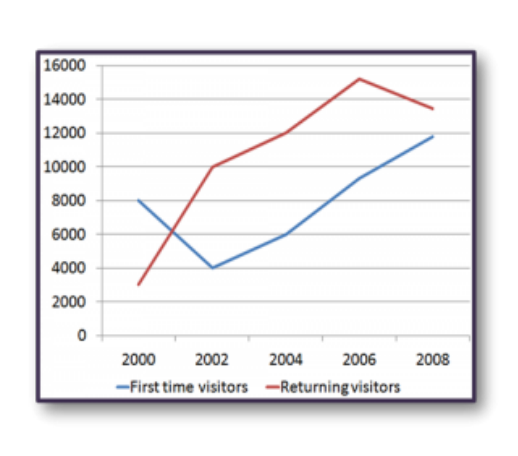
The line graph shows the number of first time visitors and returning visitors who visited Caryl Island from 2000 to 2008.
Summarise the information by selecting and reporting the main features, and make comparisons where relevant.
The line graph shows the number of first time visitors and returning visitors who visited Caryl Island from 2000 to 2008.
Student answer (Band 5.5)
The line graph illustrates how the number of the first time visitors and the returning visitors
varied in Carly island between 2000 and 2008.
Overall the number of people who came back to visit Carly island was the highest , although its number rose and fell slightly , while the number of the first time visitors showed the opposite pattern.
The line of the returning visitors sharply increased between 2000 and 2002 and remained rising slightly untill 2006 it made the highest point of the chart which is 15000 visitor.From that time everything changed and the trend is not upward anymore and it reversed its direction and started going down to 13000 in 2008.
The line of the first time visitors started at a high number which is 8000 , from the bginning it started going down steeply untill 2002 and from then everything changed ,the line started recovering and showing a very slight up trend untill the biginning of 2008.
AI examiner evaluation
| Criterion | Band |
|---|---|
| Task Achievement / Task Response | 6.0 |
| Coherence and Cohesion | 6.0 |
| Lexical Resource | 5.5 |
| Grammatical Range and Accuracy | 5.0 |
| Overall | 5.5 |
Task Achievement / Task Response: Band 6.0
You identify the overall contrast between the series and describe the main turning points: returning visitors rise sharply, peak around 2006, then decline, while first-time visitors fall before recovering. The figures you give—about 8,000 at the start, 15,000 at the returning-visitors peak and 13,000 in 2008—are close to the chart. However, the overview is not fully accurate: returning visitors do not simply “rise and fall slightly,” and the first-time series does not show the opposite pattern throughout, since it rises after 2002. The account also omits useful comparisons, such as returning visitors overtaking first-time visitors by 2002 and remaining higher. Make the overview more precise and report the first-time visitors’ final value, about 11,800.
Coherence and Cohesion: Band 6.0
The response has a clear basic structure: an introduction, an overview and separate descriptions of the two visitor groups. This makes the main progression reasonably easy to follow. You also use time markers such as “between 2000 and 2002,” “from that time” and “in 2008” to guide the reader through the data. However, some linking is mechanical or unclear. Repeated phrases such as “everything changed” do not explain the specific change, and “from then” has an unclear reference. The long sentences joined by commas also blur the sequence of events. Use shorter, clearly punctuated sentences and connect the series through direct comparisons—for example, noting when returning visitors moved above first-time visitors.
Lexical Resource: Band 5.5
You use a relevant range of trend vocabulary, including “sharply increased,” “recovering,” “highest point” and “going down,” so the reader can understand the broad movements. Some choices, however, are imprecise or repetitive: “the number of people who came back to visit” is less concise than “returning visitors,” while “everything changed” is vague for describing a reversal. There are also spelling errors, including “untill,” “bginning” and “biginning,” which reduce accuracy. Aim for precise chart language and check spelling carefully. Terms such as “peaked,” “declined” and “rose steadily” would help you describe changes more economically and distinguish the different stages of each line.
Grammatical Range and Accuracy: Band 5.0
You attempt both simple statements and longer sentences with time clauses, as in “The line of the first time visitors started at a high number … from then everything changed.” This shows some range, and the main trends remain understandable. However, several sentences are not controlled accurately. In “it made the highest point … which is 15000 visitor,” the tense shifts and the singular noun does not agree with the figure. Comma splices occur in sentences such as “From that time everything changed and the trend is not upward anymore and it reversed its direction.” Articles and punctuation are also inconsistent, including spaces before commas and missing sentence breaks. Use past tense consistently, check singular and plural forms, and divide long clauses into complete sentences.
See this exact question answered at other band scores. The same prompt compared across bands.
Browse more IELTS Writing model answers or get your own writing scored by the same AI examiner.