Band 6.0 IELTS Writing Task 1 Model Answer
Overall Band Score: 6.0 · IELTS Academic Practice Accelerator · 2026-11-16
IELTS Writing Task 1 question
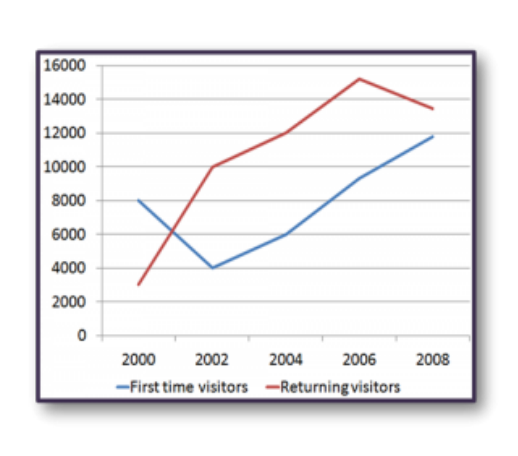
The line graph shows the number of first time visitors and returning visitors who visited Caryl Island from 2000 to 2008.
Summarise the information by selecting and reporting the main features, and make comparisons where relevant.
The line graph shows the number of first time visitors and returning visitors who visited Caryl Island from 2000 to 2008.
Student answer (Band 6.0)
The line graph illustrates the number visitors of Caryl Island who visited for first time and how many visitors returned between 2000 and 2008.
Overall, first time visitors decreased after two years, but increasesd gradually. While returning visitors showed opposite, there was less number of people in the start and was continoulsy rising for four years, a slight tranformed in the end of the year.
There was 8000 visitors in the beginning who visited Caryl Island in 2000, but declined to half number after two years. After 2000 visitors number started increased to 6000 after two years. In 2005, number of visitors had became same as the number of visitors at the start. In 2006 and 2008, visitors were climbing gradually, with almost gap of two years, 10000 and 12000 respectively.
Returning visitors accounted for the least in the starting, almost 3000, but just after one year started crossing the first time visitors and increased almost 6000 in 2001. In 2002 there was sudden fluctuation and number rose to 10000, which was showing opposite to the first time visitors. In 2004 returning visitors reached to 12000 visitors and 14000 in 2006. In contrast, there was a relatively small change in 2008 and slowly decreased returning visitors to 13000.
AI examiner evaluation
| Criterion | Band |
|---|---|
| Task Achievement / Task Response | 6.5 |
| Coherence and Cohesion | 6.5 |
| Lexical Resource | 5.5 |
| Grammatical Range and Accuracy | 5.0 |
| Overall | 6.0 |
Task Achievement / Task Response: Band 6.5
You cover both visitor groups and provide an overview of their contrasting patterns: first-time visits fell before recovering, while returning visits rose and then declined. Several key figures are reported accurately, including the first-time total of 8,000 in 2000 and the returning total of about 3,000 at the start. However, some details are inaccurate or unclear: first-time visitors reached about 9,300 in 2006, not 10,000, and the returning figure was about 15,200 in 2006, not 14,000. The claim that the series crossed after one year is unsupported by the chart, which only gives two-year intervals. The overview also describes the final change vaguely. More precise comparisons and accurate reporting of the main peaks would strengthen the response.
Coherence and Cohesion: Band 6.5
The response has a clear overall structure: an introduction, an overview, and separate discussion of first-time and returning visitors. This makes the two series easy to follow, and linking phrases such as “Overall,” “In contrast,” and “but” help signal relationships. However, some connections are mechanical or unclear. For example, “After 2000 visitors number started increased” does not clearly express the sequence, while “In 2005” interrupts the chart’s two-year timeline and makes the progression confusing. The overview’s “While returning visitors showed opposite” also lacks a clear comparison. Use more precise time references and connect each figure to the trend it illustrates; this would make the progression smoother and cohesion less dependent on basic linking words.
Lexical Resource: Band 5.5
You use relevant vocabulary for describing trends, including “decreased,” “rose,” “reached,” “gradually,” and “in contrast,” so the main information is generally understandable. There are also attempts at more specific language, such as “accounted for” and “fluctuation.” However, inaccurate word forms, spelling, and collocations are noticeable: “increasesd,” “continoulsy,” “a slight tranformed,” and “visitors number” reduce precision. Some expressions are also unnatural, such as “crossing the first time visitors” and “almost gap of two years.” Aim for standard chart language such as “overtook,” “the number of visitors,” and “a two-year interval.” A more accurate and varied set of trend expressions would make the account clearer and more natural.
Grammatical Range and Accuracy: Band 5.0
You attempt a mix of simple and more complex sentences, including contrast clauses with “but” and “while,” and most of the intended meaning can be understood. However, errors in sentence construction and verb forms occur across the response. For example, “the number visitors” is missing a grammatical element, “visitors number started increased” uses an incorrect verb pattern, and “number of visitors had became” combines verb forms incorrectly. There are also problems with articles, agreement, and sentence completeness, as in “There was 8000 visitors” and “While returning visitors showed opposite.” These errors sometimes make relationships between events difficult to follow. Practise accurate past-tense reporting and patterns such as “the number of visitors rose to…” before adding more complex clauses.
See this exact question answered at other band scores. The same prompt compared across bands.
Browse more IELTS Writing model answers or get your own writing scored by the same AI examiner.