Band 5.0 IELTS Writing Task 1 Model Answer
Overall Band Score: 5.0 · IELTS Academic Practice Accelerator · 2026-11-16
IELTS Writing Task 1 question
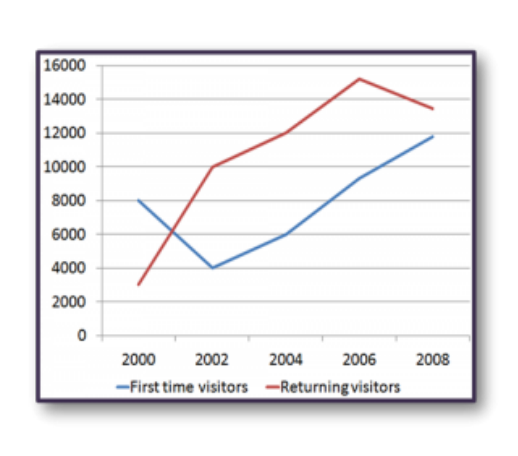
The line graph shows the number of first time visitors and returning visitors who visited Caryl Island from 2000 to 2008.
Summarise the information by selecting and reporting the main features, and make comparisons where relevant.
The line graph shows the number of first time visitors and returning visitors who visited Caryl Island from 2000 to 2008.
Student answer (Band 5.0)
This line graph represents the number of newly visitors and old visitors that came to Caryl Island from 2000 to 2008.
overall,the returning visitors number are in 2000 is less but from onward to 2000 it start increasing and in 2008 it is high from newly visitors number.
In 2000 the number of those visitors who visit Caryl Island again is 3000 it is quite less then first time visitors in 2000 whoes proportion is 8000 .Then in 2002 the first time visitors ratio have a deep spike and comes at 4000 but in the case of old visitors their ratio have a sudden spike and reaches at 10000 . After two years the amount of people who come for first time is 6000 and who visited again is 12000. After a couple of years both visitors ratio increasea and comes at 14000 and 10000 respectively .
In 2008 the returning people amount starts decreasing and came at 13000 and first time visit
AI examiner evaluation
| Criterion | Band |
|---|---|
| Task Achievement / Task Response | 5.5 |
| Coherence and Cohesion | 5.0 |
| Lexical Resource | 5.0 |
| Grammatical Range and Accuracy | 5.0 |
| Overall | 5.0 |
Task Achievement / Task Response: Band 5.5
You identify both visitor groups and report several relevant figures, including 3,000 returning visitors and 8,000 first-time visitors in 2000, followed by 10,000 and 4,000 respectively in 2002. You also recognise that returning visitors peak before declining, while first-time visitors rise after 2002. However, the overview is unclear and partly inaccurate: “from onward to 2000” does not describe the period correctly, and the claim that both groups increase after 2004 is wrong because returning visitors fall from about 15,200 in 2006 to 13,400 in 2008. The final sentence is unfinished, leaving the last comparison incomplete. Select the main trends clearly and check each figure and direction of change against the graph.
Coherence and Cohesion: Band 5.0
The response follows the timeline from 2000 to 2008 and uses paragraph breaks, so the reader can identify the general subject and sequence. However, there is no clear, well-developed progression from an overview to organised details. The overview is difficult to interpret, and the body moves through years using repetitive links such as “Then,” “After two years,” and “After a couple of years.” Some references are also unclear, as in “both visitors ratio,” while the final sentence stops before completing its point. Use a distinct overview followed by a paragraph comparing the main changes, and make each transition connect ideas accurately rather than simply marking time.
Lexical Resource: Band 5.0
You use some task-relevant vocabulary, including “first time visitors,” “returning visitors,” “increasing,” and “decreasing,” which helps communicate the graph’s subject and broad movements. However, the range is limited and several expressions are unnatural or imprecise, such as “newly visitors,” “old visitors,” “their ratio,” and “the amount of people.” These choices sometimes make the intended meaning harder to follow, particularly when describing visitor numbers. There are also noticeable word-form and spelling errors, including “increasea” and “whoes.” Build a more precise set of terms for describing quantities and trends, and use standard labels consistently, such as “first-time visitors” and “returning visitors.”
Grammatical Range and Accuracy: Band 5.0
The response attempts to combine information in longer sentences, for example, “Then in 2002 the first time visitors ratio have a deep spike and comes at 4000,” but these attempts often contain errors that make relationships difficult to understand. Problems include subject–verb agreement (“the returning visitors number are”), tense and verb forms (“it start increasing”), and sentence boundaries, as in the long sentence beginning “In 2000 the number…” Several clauses are joined without clear punctuation, and the final sentence is incomplete. Most structures are simple or extended through faulty coordination, so meaning is not consistently easy to follow. Practise accurate past-tense reporting and build shorter, complete comparison sentences before adding more complex clauses.
See this exact question answered at other band scores. The same prompt compared across bands.
Browse more IELTS Writing model answers or get your own writing scored by the same AI examiner.