Band 6.0 IELTS Writing Task 1 Model Answer
Overall Band Score: 6.0 · IELTS Academic Practice Accelerator · 2026-11-16
IELTS Writing Task 1 question
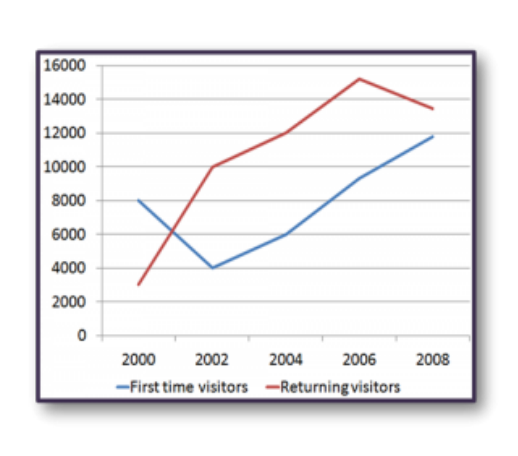
The line graph shows the number of first time visitors and returning visitors who visited Caryl Island from 2000 to 2008.
Summarise the information by selecting and reporting the main features, and make comparisons where relevant.
The line graph shows the number of first time visitors and returning visitors who visited Caryl Island from 2000 to 2008.
Student answer (Band 6.0)
The Line graph tracks the changes in the tourists who were returning and visiting Caryl island for the first time between 2000 to 2008.
Overall, it can be analysed that the line sparked an increased for returning visitors from the island whereas, the first time tourists were seen less as copared to the returning tourists over the given period of time.
Firstly, There were 8000 new tourists in the year 2000, while the number of visitors declined in 2002 which were 4000.Then looking at the graph it can be noticed that the graph had an upward position because the number rose to 6000 in the year 2004, then again 10,000 in the year 2006 and atlast 12,000 in the last year which is 2008.
The other line graph depicts the returning visitors,and it can be noticed that the line had a rise that went around approximately 3000 tourists in the year 2000, while in 2002 the figure rose to 10,000, in 2004 it increased to 12,000, in 2006 the visitors returning were 15,000 but then, the figure fell to 13000 in 2008.
AI examiner evaluation
| Criterion | Band |
|---|---|
| Task Achievement / Task Response | 6.0 |
| Coherence and Cohesion | 6.0 |
| Lexical Resource | 5.5 |
| Grammatical Range and Accuracy | 5.5 |
| Overall | 6.0 |
Task Achievement / Task Response: Band 6.0
You cover both visitor groups and report the main movements, including the first-time visitors’ fall to 4,000 in 2002 and subsequent recovery, and the returning visitors’ rise to a peak in 2006 followed by a decline. The overview identifies the broad contrast, but “an increased for returning visitors” is unclear and does not accurately capture that this series peaked and then fell. Some figures are also imprecise: first-time visitors are about 9,300 in 2006 and 11,800 in 2008, while returning visitors are about 15,200 and 13,400 in those years. These approximations are understandable, but closer reporting would strengthen the comparison. Make the overview more precise and explicitly compare the series at key points.
Coherence and Cohesion: Band 6.0
The response has a clear overall arrangement: an introduction, an overview, and separate paragraphs for the two visitor groups. This makes the information easy to follow, and sequencing expressions such as “Firstly,” “in 2002,” and “in 2004” help show chronology. However, some linking is mechanical or awkward, particularly “Then looking at the graph it can be noticed,” and the long sentences in the body make several data points feel crowded together. The overview’s contrast is also not expressed clearly, which weakens the connection between the two series. Use more direct transitions and divide the data into shorter, well-controlled sentences; a concise comparison between the groups would improve progression.
Lexical Resource: Band 5.5
You use enough topic vocabulary to describe the graph, including “declined,” “rose,” “figure,” and “visitors returning,” so the main trends are generally understandable. However, several choices are inaccurate or unnatural for formal data reporting: “the line sparked an increased,” “the line had a rise,” and “the graph had an upward position.” There are also spelling and form errors, such as “copared,” and inconsistent capitalisation of “Caryl island.” These do not prevent understanding, but they limit precision and naturalness. Prefer standard collocations such as “the number increased,” “reached a peak,” and “fell,” and use “first-time visitors” consistently rather than switching among “new tourists” and “first time tourists.”
Grammatical Range and Accuracy: Band 5.5
You attempt both simple and more complex sentence forms, including clauses joined with “while” and “whereas,” and the reader can generally understand the trends. Some grammatical and punctuation errors remain. For example, “between 2000 to 2008” uses an incorrect preposition pattern; write “between 2000 and 2008.” In “the number of visitors declined in 2002 which were 4000,” the relative clause does not agree clearly with its subject. Several sentences also run on, as in the final paragraph, where multiple years and clauses are joined with commas. Capitalisation after full stops and spacing after punctuation are inconsistent. Use shorter sentences, check subject–verb agreement, and punctuate each data point clearly.
See this exact question answered at other band scores. The same prompt compared across bands.
Browse more IELTS Writing model answers or get your own writing scored by the same AI examiner.