Band 5.0 IELTS Writing Task 1 Model Answer
Overall Band Score: 5.0 · IELTS Academic Practice Accelerator · 2026-11-16
IELTS Writing Task 1 question
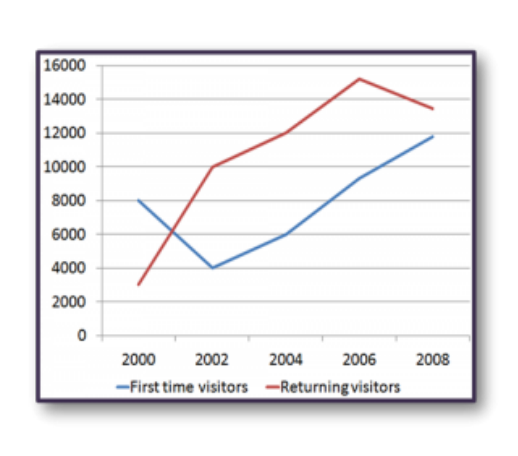
The line graph shows the number of first time visitors and returning visitors who visited Caryl Island from 2000 to 2008.
Summarise the information by selecting and reporting the main features, and make comparisons where relevant.
The line graph shows the number of first time visitors and returning visitors who visited Caryl Island from 2000 to 2008.
Student answer (Band 5.0)
The line graph illustrates the number of first time visitors and returning visitors who visited Caryl island from 2000 to 2008. In this graph that shows the number of visitors visit caryl island first time and again visit second time.
As we see the result of starting means in 2000 there are not sufficent response from visitors that visit second time as compared to the result of first time. furthermore, after some time there is increasing in the number of visitors who visit again there is a large difference between the result of visitors visit first time to Caryl island. And at the end there is again drop the rate of visitors visit to the caryl but still the result is higher than the visitors visit first time.
As we seen the result by numbers now, In 2000, 8000 visitors visit fist time and only 3000 visitors return for visit,. 2002, 4000 visitors visit first time and 10000 visitors return for visit. In nexr years from 2004 and 2006, there are same rate of growth 2000 in both lines. In last year 2008, 12000 visitors visit first time and approximatley 13750 returning visitors visit to Caryl island. This is the whole conclusion of visitors visit to Caryl island.
AI examiner evaluation
| Criterion | Band |
|---|---|
| Task Achievement / Task Response | 5.5 |
| Coherence and Cohesion | 5.5 |
| Lexical Resource | 4.5 |
| Grammatical Range and Accuracy | 5.0 |
| Overall | 5.0 |
Task Achievement / Task Response: Band 5.5
You identify both visitor groups and report several relevant figures, including the 2000 and 2002 values and the approximate 2008 totals. However, the main trends are only partly and sometimes unclearly summarised. The graph shows returning visitors rising from about 3,000 to a peak of 15,200 in 2006, then falling to 13,400; first-time visitors fall initially, then rise steadily to about 11,800. Your statement that both lines had the same growth of 2,000 in 2004 and 2006 is inaccurate: their changes differ, and the returning series rises by about 3,200 from 2004 to 2006. Give a clear overview of these contrasting patterns and check comparisons against the data.
Coherence and Cohesion: Band 5.5
The response has a basic sequence: an introduction, a general description, and then a paragraph with figures. This gives the reader some organisation, and time markers such as “In 2000” and “In last year 2008” help locate information. However, progression is weakened by repetition of the introduction and by a general paragraph whose relationships are difficult to follow, for example, “there is a large difference between the result” without specifying which years or values. Linking words such as “furthermore” and “And” do not always clarify the connection between ideas. Group the overview separately, then compare the two series in a logical order, using clear references to the years and trends.
Lexical Resource: Band 4.5
You use some task-relevant terms, including “first time visitors,” “returning visitors,” “increasing,” and “drop,” so the topic is generally understandable. However, vocabulary is limited and repetitive, especially the repeated phrase “visitors visit,” and several expressions are inaccurate or unnatural, such as “not sufficent response from visitors” and “same rate of growth 2000.” Spelling errors including “sufficent,” “fist,” “nexr,” and “approximatley” also reduce control. Choose precise trend language and vary the nouns and verbs: for example, describe visitor numbers as rising, declining, reaching a peak, or recovering. Use “first-time visitors” and “returning visitors” consistently.
Grammatical Range and Accuracy: Band 5.0
You attempt both simple statements and longer sentences, but the range is limited and errors occur frequently enough to make some sentences difficult to interpret. For example, “In this graph that shows the number of visitors visit…” is an incomplete construction, while “there is increasing in the number” and “there is again drop” have faulty sentence patterns and missing articles. Verb forms and agreement are also inconsistent in “visitors visit” and “As we seen.” Punctuation is unreliable, including the comma and full stop around “visit,.” Build clear subject–verb sentences, such as “The number of returning visitors increased,” and check articles, tense, and sentence boundaries before finishing.
See this exact question answered at other band scores. The same prompt compared across bands.
Browse more IELTS Writing model answers or get your own writing scored by the same AI examiner.