Band 5.5 IELTS Writing Task 1 Model Answer
Overall Band Score: 5.5 · IELTS Academic Practice Accelerator · 2026-11-17
IELTS Writing Task 1 question
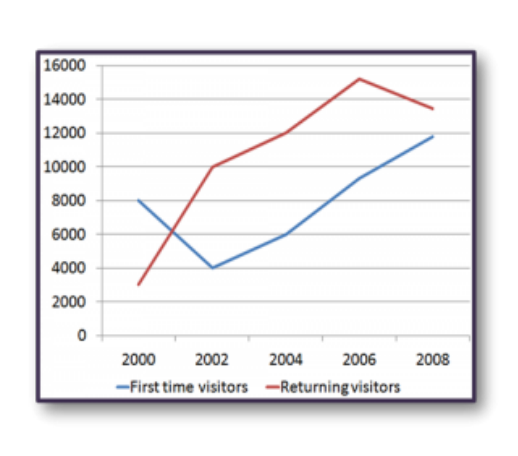
The line graph shows the number of first time visitors and returning visitors who visited Caryl Island from 2000 to 2008.
Summarise the information by selecting and reporting the main features, and make comparisons where relevant.
The line graph shows the number of first time visitors and returning visitors who visited Caryl Island from 2000 to 2008.
Student answer (Band 5.5)
The line graph illustrates the number of first time visitors and returning visitors who visited Caryl Island from 2000 to 2008.
Overall, a majority number of visitors were returning visitors. It showed increased significantly between 2000 and 2006. While in 2006 to in 2008 it was gradually declined. However, first time visitors strating at the major number of visitors. Meanwhile, it decreased significantly between 2000 and 2002. Although durning 2002 and 2008 it gradually rose. In 2001 both first time and retuning visitors lines accrosed and it had approximately equal number of visitors visited Caryl Island.
Initially, in 2000 first time around 8000 number of visitors were visited Caryl Island. In addition, returning visitors amount were higher lower than the first time visitors in 2000. Furthermore, both first time and returning visitors were accrosed the lines in 2001 and it had 6000 number of visitors who visited Caryl Island. Moreover, retuning visitors line increased significantly during 2000 and 2006. But in 2006 it declined slightly. At the end of period, approximately [redacted phone] number of visitors visited Caryl Island. Looking at the first time visitors, between 2000 and 2002 it showed gradually decreased. Although during 2002 and 2008 it had rose significantly. At the end of period, it had 12000 number of visitors visited Caryl Island.
In summary, a majority number of visitors were retuning visitors than fisrt time visitors who visited Caryl Island from 2000 to 2008. However, a significant number of people were enjoyed the visited Caryl Island from 2000 to 2008.
AI examiner evaluation
| Criterion | Band |
|---|---|
| Task Achievement / Task Response | 6.0 |
| Coherence and Cohesion | 5.5 |
| Lexical Resource | 5.0 |
| Grammatical Range and Accuracy | 5.0 |
| Overall | 5.5 |
Task Achievement / Task Response: Band 6.0
You cover both visitor groups and identify the main broad patterns: returning visitors rise to a peak before falling, while first-time visitors dip and then recover. However, several key details are inaccurate or unclear. The lines cross in 2002, not 2001, and at that point the figures are not equal: returning visitors are about 10,000 and first-time visitors about 4,000. The claim that returning visitors were the majority throughout is also incorrect, since first-time visitors were higher in 2000. The final returning figure is given as “139500,” rather than approximately 13,400. Your overview is relevant, but these misreadings and unclear comparisons mean some features are reported less fully than others.
Coherence and Cohesion: Band 5.5
The response has a recognisable structure, with an introduction, an overview, a paragraph of details and a concluding sentence. You also attempt to connect ideas using words such as “Overall,” “Meanwhile” and “Furthermore.” However, progression is weakened by repetition: the overview and conclusion both repeat that returning visitors were the majority, and the body revisits trends already mentioned without consistently organising the figures by period or series. Some links are confusing, particularly “In addition, returning visitors amount were higher lower than the first time visitors,” which makes the comparison difficult to follow. Grouping the two series clearly and describing their changes in chronological order would make the report easier to track.
Lexical Resource: Band 5.0
You use relevant task vocabulary, including “visitors,” “increased,” “declined” and “approximately,” so the reader can generally recognise the topic and intended trends. However, the range is limited and several word choices or collocations are inaccurate or repetitive. Phrases such as “a majority number,” “it had rose,” and “a significant number of people were enjoyed the visited” are not natural ways to describe graph data. Spelling errors such as “strating,” “durning,” “retuning” and “fisrt” also reduce accuracy. Aim for precise reporting verbs and standard collocations, for example, “the figure rose” or “the number of returning visitors.”
Grammatical Range and Accuracy: Band 5.0
You attempt both simple statements and longer sentences with contrast clauses, such as “Although during 2002 and 2008 it had rose significantly.” This shows an effort to vary sentence forms, but control is inconsistent, and errors sometimes make relationships between ideas hard to understand. Examples include “It showed increased significantly,” “returning visitors amount were,” and “people were enjoyed.” Verb forms, agreement and sentence construction need attention; for instance, use “it increased significantly,” “the number of returning visitors was,” and “people enjoyed visiting.” Some sentences also lack a clear grammatical subject or contain awkward clause combinations. Practising accurate past-tense descriptions of rises, falls and comparisons will improve clarity.
See this exact question answered at other band scores. The same prompt compared across bands.
Browse more IELTS Writing model answers or get your own writing scored by the same AI examiner.