Band 5.5 IELTS Writing Task 1 Model Answer
Overall Band Score: 5.5 · IELTS Academic Practice Accelerator · 2026-11-17
IELTS Writing Task 1 question
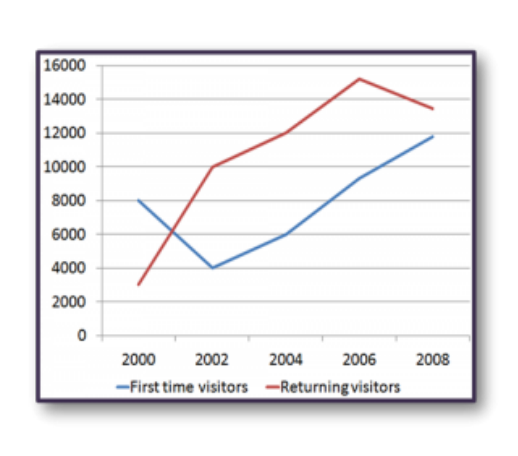
The line graph shows the number of first time visitors and returning visitors who visited Caryl Island from 2000 to 2008.
Summarise the information by selecting and reporting the main features, and make comparisons where relevant.
The line graph shows the number of first time visitors and returning visitors who visited Caryl Island from 2000 to 2008.
Student answer (Band 5.5)
The given graph demonstrates the number of first time visitors and returning visitors of Caryl Island in the year-2000,2002,2004,2006 and 2008.
Overall we can see first time visitors were low at 2000 and it rose dramatically in 2006 and falls down in 2008.On the other hand returning visitors were at a sustain level.But after 2 years it falls down and taking a break it also jumped at its peak in 2008.
When we look at first time visitors in 2000 we can see it was a number of 8000 people.Then in 2002 it falls down and stands on its half.After taking a break it grows dramatically and became 6000 in 2006,around 9000 in 2006 and alomost 12000 in 2008.
Stepping onto returning visitors we can notice it was approximately 3000 in 2000.In two years it jumped at 10000 which is a magical rose.In 2004 it rised 2000 more and in 2006 it stands on around 15000+.But in 2008 it takes a decrease and stands less than 14000.
AI examiner evaluation
| Criterion | Band |
|---|---|
| Task Achievement / Task Response | 5.5 |
| Coherence and Cohesion | 5.5 |
| Lexical Resource | 5.0 |
| Grammatical Range and Accuracy | 5.0 |
| Overall | 5.5 |
Task Achievement / Task Response: Band 5.5
You identify both visitor groups and report several key figures, including the first-time visitors’ fall from 8,000 to 4,000 and the returning visitors’ rise from 3,000 to about 15,000. However, the overview is unclear and contains important inaccuracies: first-time visitors did not fall in 2008, but continued rising to nearly 12,000; returning visitors peaked in 2006, then declined in 2008, rather than reaching their peak then. There is also a confusing sequence in the first-time visitor paragraph: 6,000 is assigned to 2006 before about 9,000 is also assigned to 2006. These errors weaken the summary of the main trends. Make the overview accurate, then report each year’s figures in a clear sequence.
Coherence and Cohesion: Band 5.5
The response has a basic structure: an introduction, an overview, and separate paragraphs for the two visitor groups. This gives the reader some sense of how the information is organised. However, progression within paragraphs is not always clear, and the overview does not reliably guide the reader because it misstates the trends. Linking phrases such as “On the other hand,” “When we look at,” and “Stepping onto” are used, but some sound mechanical or do not clarify the relationship between points. The first-time visitor paragraph is especially difficult to follow because it repeats 2006 and gives conflicting values. Organise the figures chronologically and use straightforward links such as “By 2004” and “In contrast” to make comparisons clearer.
Lexical Resource: Band 5.0
You use some relevant vocabulary for describing trends, including “rose,” “jumped,” “decrease,” and “approximately,” so the main subject is generally understandable. However, the range is limited and several choices are inaccurate or unnatural for a graph description. “Magical rose” does not convey a suitable analytical meaning, while “taking a break” and “stands on its half” are unclear descriptions of changes or values. There are also spelling and word-form errors, such as “alomost” and “rised.” Choose precise, conventional terms and use them consistently: for example, describe a value as “fell to half its previous level” or say that a figure “increased by 2,000.” This would make the account more precise and easier to read.
Grammatical Range and Accuracy: Band 5.0
You attempt both simple and longer sentence forms, including “When we look at first time visitors in 2000 we can see…” and “But in 2008 it takes a decrease…”. However, control is inconsistent, and errors in tense, sentence boundaries, and punctuation occur frequently enough to make some statements difficult to interpret. For example, “it rose dramatically in 2006 and falls down in 2008” shifts tense and gives an incorrect trend, while “In 2004 it rised 2000 more” has an incorrect verb form and an incomplete comparison. Several sentences also run together without spaces after full stops. Use past tense consistently for the historical data, check subject–verb forms, and separate each complete idea with accurate punctuation.
See this exact question answered at other band scores. The same prompt compared across bands.
Browse more IELTS Writing model answers or get your own writing scored by the same AI examiner.