Band 5.5 IELTS Writing Task 1 Model Answer
Overall Band Score: 5.5 · IELTS Academic Practice Accelerator · 2026-11-18
IELTS Writing Task 1 question
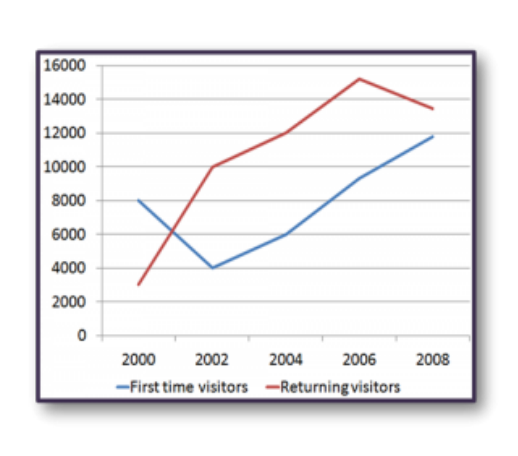
The line graph shows the number of first time visitors and returning visitors who visited Caryl Island from 2000 to 2008.
Summarise the information by selecting and reporting the main features, and make comparisons where relevant.
The line graph shows the number of first time visitors and returning visitors who visited Caryl Island from 2000 to 2008.
Student answer (Band 5.5)
The line grapgh illustrates the count of first time visitors and returning visitors who visited Caryl Island between 2000 till 2008.
On the first hand, The people who are visiting the Caryl Island for the first time started with huge number in 2000 but it drops by very next year. However the visitors are increasing after the 2002 and the number are continously incling till 2008. Which means the new visitor have increased between the year of 2000 till 2008.
On the other hand, visitors who have already visited Caryl Island were extremly low in 2000 however number of visitors has a enormous sharp in coming year. Even number are still increasing and went on the peak with almost 15000 visitors. Then a slight drop in 2008.
Overall, Numbers of first and returning visitors had a huge gap in 2000 however it inclined over the years and gap of visitor became lesser by 2008.
AI examiner evaluation
| Criterion | Band |
|---|---|
| Task Achievement / Task Response | 5.5 |
| Coherence and Cohesion | 5.5 |
| Lexical Resource | 5.5 |
| Grammatical Range and Accuracy | 5.0 |
| Overall | 5.5 |
Task Achievement / Task Response: Band 5.5
You identify both visitor groups and describe their broad trends, including the rise in first-time visitors after 2002 and the returning visitors’ peak followed by a decline. However, some details are inaccurate or unclear: first-time visitors fell from 8,000 to 4,000 by 2002, not “by very next year,” and the overall gap did not simply become lesser by 2008—the returning group still exceeded first-time visitors. The overview is also imprecise, and several key comparisons could be supported with figures. The response is 143 words, below the 150-word minimum; the 11 words copied from the prompt are not counted. Add a concise, accurate comparison of the groups and their endpoints to address the task more fully.
Coherence and Cohesion: Band 5.5
The response has a basic structure: an introduction, separate paragraphs for the two visitor groups, and an overall statement. This gives the reader a general route through the information. However, progression within the paragraphs is sometimes difficult to follow, and the linking phrases are either awkward or do not express the relationship precisely. For example, “On the first hand” and “On the other hand” are not natural choices for comparing graph trends, while “Even number are still increasing” leaves the reference unclear. The overview appears at the end rather than clearly guiding the report. Organise the data chronologically within each group, use straightforward links such as “By contrast” or “Meanwhile,” and make references explicit.
Lexical Resource: Band 5.5
You use some task-relevant vocabulary, including “visitors,” “peak,” “sharp,” and “drop,” and the reader can generally understand the trends you intend to describe. However, the range is limited and several word choices or collocations are inaccurate, which makes parts of the report awkward: “huge number,” “a enormous sharp,” and “incling” do not convey the data naturally. There are also spelling errors such as “grapgh,” “extremly,” and “continously.” Aim for precise trend language and check spelling and word forms. For example, describe figures as “rose sharply,” “reached a peak,” or “declined slightly,” rather than relying on vague or incorrectly formed expressions.
Grammatical Range and Accuracy: Band 5.0
You attempt both simple and more extended sentences, but control is inconsistent, and errors sometimes make the relationships between ideas hard to interpret. Examples include “the number are continously incling,” where the subject and verb do not agree, and “the visitors are increasing after the 2002,” which has an unnecessary article and an awkward tense choice for a completed period. Sentence fragments also occur, as in “Which means the new visitor have increased…”. Capitalisation after commas is inconsistent, and some sentences join ideas without clear punctuation. Practise accurate past-tense reporting, subject–verb agreement, and complete sentence construction. Short, controlled sentences can help you report each trend clearly before attempting more complex structures.
See this exact question answered at other band scores. The same prompt compared across bands.
Browse more IELTS Writing model answers or get your own writing scored by the same AI examiner.