Band 5.0 IELTS Writing Task 1 Model Answer
Overall Band Score: 5.0 · IELTS Academic Practice Accelerator · 2026-11-18
IELTS Writing Task 1 question
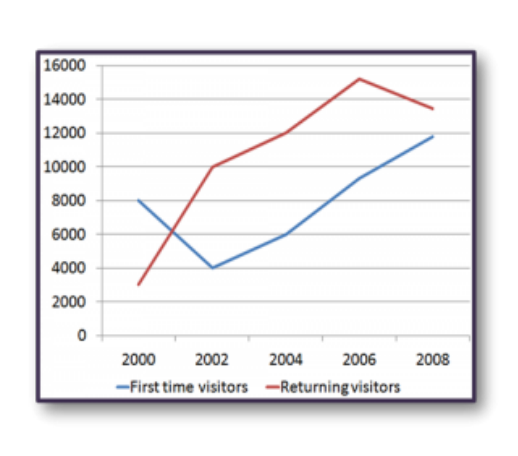
The line graph shows the number of first time visitors and returning visitors who visited Caryl Island from 2000 to 2008.
Summarise the information by selecting and reporting the main features, and make comparisons where relevant.
The line graph shows the number of first time visitors and returning visitors who visited Caryl Island from 2000 to 2008.
Student answer (Band 5.0)
The line graph illustrates the figure of who visitors visit the Carly island between 2000 to 2008 and information about the first time visitors and returning visitors.
The line graph explain the first time visitors and returning visitors in numbers. Higher number of returning visitors in 2006 and lower number visitors in 2000 at situation higher number of first time visitors in 2008 and lower number of first visitors in 2002.
In year 2000, 8000 people visit the Carly island in first time at same time camper to returning visit only 3000. After 2 year decrees the number of first time visitors has 4000 and incurring the number of returning visitors 10000. After some regular incurring the number of first time visitors in year 2004 has number of 6000 year 2006 has number of 9000 and in year 2008 has number of 11900.
In year 2000 to 2006 incurring the number of returning visitors in year 2004 was number of 12000 and year 2006 was number of 15000 and in the year 2006 to 2008 the returning visitors number was decrees the number was 13600.
AI examiner evaluation
| Criterion | Band |
|---|---|
| Task Achievement / Task Response | 5.0 |
| Coherence and Cohesion | 5.0 |
| Lexical Resource | 5.0 |
| Grammatical Range and Accuracy | 4.5 |
| Overall | 5.0 |
Task Achievement / Task Response: Band 5.0
You identify both visitor groups and report several relevant figures, including the fall in first-time visitors to 4,000 in 2002 and the rise in returning visitors to around 15,000 in 2006. However, the response only partly summarises the main features: it does not clearly state the overall pattern that returning visitors generally increased before falling, while first-time visitors recovered and rose after 2002. The overview is also difficult to interpret, and the claim that the lowest number of visitors was in 2000 is inaccurate for first-time visitors, whose low point was 2002. A clearer overview and more precise comparisons between the two series would make the report more complete and better focused on the task.
Coherence and Cohesion: Band 5.0
The response has separate paragraphs and broadly moves from an introduction to an overview and then to details, so there is some organisation. However, the progression is not consistently clear: the second paragraph repeats the topic without giving a precise overview, and the final paragraph begins with 2000–2006 but then shifts to the later decline. Linking phrases such as “After 2 year” and “After some regular” do not clearly express the relationships between the data points. Grouping the two series into a more deliberate sequence, and using clear transitions such as “By contrast” or “From 2006 to 2008,” would help readers follow the comparisons. Some repetition of “the number” also makes the report less cohesive.
Lexical Resource: Band 5.0
You use relevant task vocabulary, including “first time visitors,” “returning visitors,” and “number,” and the reader can generally identify the two categories being described. However, the range is limited and several noticeable word-choice or spelling errors make parts difficult to understand. For example, “incurring” is repeatedly used where a verb meaning “increasing” is needed, while “decrees” appears to mean “decreased.” Phrases such as “the figure of who visitors visit” and “at situation” are not natural ways to describe a graph. Aim for accurate, conventional trend language and vary repeated wording with terms such as “visitor numbers,” “rose,” “fell,” and “reached a peak.”
Grammatical Range and Accuracy: Band 4.5
The response mainly relies on simple sentence patterns, with limited control when attempting longer structures. Errors in verb forms, articles, and sentence construction occur frequently and sometimes make the intended meaning hard to follow. For instance, “The line graph explain” has subject–verb disagreement, and “8000 people visit the Carly island in first time” lacks appropriate tense and article use. The sentence beginning “After 2 year” also does not form a clear grammatical comparison. Try building accurate sentences with a consistent past tense, for example, “In 2000, 8,000 people visited the island for the first time, compared with 3,000 returning visitors.” Check agreement, articles, and punctuation when revising.
See this exact question answered at other band scores. The same prompt compared across bands.
Browse more IELTS Writing model answers or get your own writing scored by the same AI examiner.