Band 5.0 IELTS Writing Task 1 Model Answer
Overall Band Score: 5.0 · IELTS Academic Practice Accelerator · 2026-11-18
IELTS Writing Task 1 question
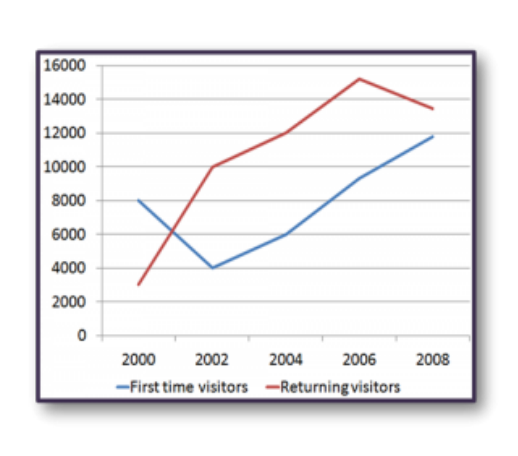
The line graph shows the number of first time visitors and returning visitors who visited Caryl Island from 2000 to 2008.
Summarise the information by selecting and reporting the main features, and make comparisons where relevant.
The line graph shows the number of first time visitors and returning visitors who visited Caryl Island from 2000 to 2008.
Student answer (Band 5.0)
The given line graph illustrates the number of first time visitors and returning visitors who visited Caryl Island from 2000 to 2008.
Overall it can be implied that, the number of first time visitors line graph was rapildly reducing in 2000 and 2002 then it dramatically rose in 2002 and 2008.. On the other hand it can be seen that the returning visitors line graph was flatuating constantly it was raising in 2000 and 2006 then it was fallen in 2006 and 2008.
It can be seen that , the highest first time visitors were in 2008 where the number of visitors were 12,000. Likewise, the second highest were in 2006 where the number of visitrs were 10,000.On the other hand the lowest first time visitors were in 2002 where the number of visitors were 4000. Likewise the second lowest first time visitors were in 2000 and also in 2004 where the number of visitors were 6000.
On the other hand, the highest returning visitors were 2006 where the number of visitors were between 16,000 and 14,000. Likewise the second highest returning visiotrs were in 2008 where the number of visitors were between 12,000 and 14,000. On the other hand, the lowest returning visitors were in 2000 where the number of visiotrs were between 2000 and 4000 visitors . Likewise the second lowest returning visitors were in between 2000 and 2002 where the number of visitors were 6000.
AI examiner evaluation
| Criterion | Band |
|---|---|
| Task Achievement / Task Response | 5.0 |
| Coherence and Cohesion | 5.0 |
| Lexical Resource | 5.0 |
| Grammatical Range and Accuracy | 5.0 |
| Overall | 5.0 |
Task Achievement / Task Response: Band 5.0
You identify both visitor groups and report several key years, including the first-time visitor low in 2002 and the returning visitor peak in 2006. However, the overview is unclear and contains inaccurate trends: first-time visitors fell from 8,000 to 4,000, then rose to 11,800, rather than rising only from 2002 to 2008 as stated. Returning visitors rose from 3,000 to 15,200 by 2006, then declined to 13,400; describing this as constant fluctuation obscures the main pattern. Some comparisons are also incorrect: first-time visitors reached about 9,300 in 2006, not 10,000, and 2004 was not a second-lowest point. Focus on accurate overall trends and select a few reliable comparisons.
Coherence and Cohesion: Band 5.0
The response has a basic paragraph structure, moving from an introduction and overview to separate descriptions of the two visitor groups. This gives the reader some organisation. However, progression within the paragraphs is limited because the information is mainly presented as repeated highest/second-highest/lowest statements rather than as a clear account of change over time. Linking phrases such as “Likewise” and “On the other hand” are used frequently, sometimes where no contrast is needed, and the overview’s sequence of years is confusing. Group the figures into meaningful trends—for example, the rise and later fall in returning visitors—and use fewer, more precise transitions to make comparisons easier to follow.
Lexical Resource: Band 5.0
You use relevant task vocabulary, including “first time visitors,” “returning visitors,” “highest,” and “lowest,” so the topic remains understandable. However, the range is limited and several expressions are repeated, particularly “the number of visitors” and “On the other hand.” There are also noticeable spelling errors, such as “rapildly,” “flatuating,” “visitrs,” and “visiotrs,” which reduce accuracy. Some word choices are imprecise for describing a graph: “flatuating constantly” does not clearly express the steady rise followed by a decline, and “were between 16,000 and 14,000” is an awkward way to report an approximate value. Use accurate trend verbs and concise numerical phrasing.
Grammatical Range and Accuracy: Band 5.0
The response attempts some longer sentences and uses basic past-tense forms, but the range of sentence structures is limited and errors occur frequently. For example, “the number of first time visitors line graph was” has an unclear grammatical structure, while “the returning visitors … it was fallen” uses an incorrect verb form. Agreement is also inconsistent in “the highest first time visitors were … where the number of visitors were.” Punctuation and spacing are unreliable, including the double full stop after “2008..” and missing spaces after some full stops. Build clearer sentences with a subject and verb for each trend, and check past-tense forms, singular/plural agreement, and punctuation.
See this exact question answered at other band scores. The same prompt compared across bands.
Browse more IELTS Writing model answers or get your own writing scored by the same AI examiner.