Band 5.5 IELTS Writing Task 1 Model Answer
Overall Band Score: 5.5 · IELTS Academic Practice Accelerator · 2026-11-20
IELTS Writing Task 1 question
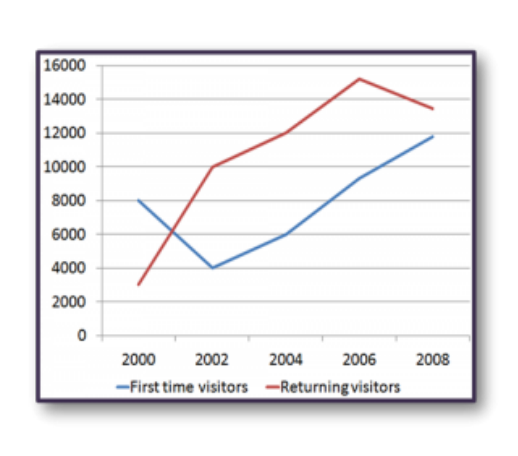
The line graph shows the number of first time visitors and returning visitors who visited Caryl Island from 2000 to 2008.
Summarise the information by selecting and reporting the main features, and make comparisons where relevant.
The line graph shows the number of first time visitors and returning visitors who visited Caryl Island from 2000 to 2008.
Student answer (Band 5.5)
The line graph represents how many visitors visited Caryl Island for the very first time in life and how many visitors visited it more often from 2000 to 20008.
Overall, The number of Often visitors visited highest in 2006 and lowest in 2002 while very first time visitors came here highest time in 2008 and lowest time in 2002.
To commence with, first time visitors were about 8000 in 2000, lowest of 4000 in 2002, around 6000 in 2004, approximately 9000 in 2006 and highest of 12000 in 2008.
Meanwhile on the other hand, the number of often visitors were around 3000 in 2000 which is the lowest on the graph than increased impressively to 10000 in 2002 than a bit rise to 12000 in 2004 than it is the highest on the graph to almost 15000 in 2006 and at the end a small decline to approximately 13000 in 2008.
AI examiner evaluation
| Criterion | Band |
|---|---|
| Task Achievement / Task Response | 6.0 |
| Coherence and Cohesion | 6.0 |
| Lexical Resource | 5.5 |
| Grammatical Range and Accuracy | 5.0 |
| Overall | 5.5 |
Task Achievement / Task Response: Band 6.0
You cover both visitor groups and report the main movements accurately: first-time visitors fall from about 8,000 to 4,000 before rising to roughly 12,000, while returning visitors climb to a peak in 2006 and then decline. The overview identifies the key high and low points, and the figures are generally consistent with the graph. However, the comparison between the two groups is not made explicit, and the overview could better summarise their contrasting overall patterns—for example, returning visitors remain higher from 2002 onward, whereas first-time visitors rise steadily after 2002. Some descriptions, such as “increased impressively,” are evaluative rather than precise. A clearer overview and more direct comparisons would make the report more complete and developed.
Coherence and Cohesion: Band 6.0
The response has a recognisable structure: an introduction, an overview, and separate descriptions of the two series. This gives the information an overall coherent arrangement, and the reader can follow the chronology. However, cohesion is sometimes mechanical or awkward. “Meanwhile on the other hand” combines two contrasting linkers unnecessarily, while repeated “than” in the final paragraph makes the sequence difficult to process. The overview also repeats the same high-and-low pattern later rather than establishing a broader comparison. Use a small range of clear transitions, such as “By contrast” and “After reaching a peak,” and connect the series directly so the progression feels smoother.
Lexical Resource: Band 5.5
You use enough topic vocabulary to describe the graph, including “visitors,” “decline,” “lowest,” and “approximately,” and the intended meaning is usually clear. There are also attempts to vary expression, such as “first time” and “often visitors.” However, several choices are unnatural or imprecise: “very first time in life,” “Often visitors,” and “came here highest time” do not sound idiomatic in a formal report. “Increased impressively” is also subjective, and “a bit rise” is an inaccurate word form. Aim for standard graph language and consistent labels for the two groups. More precise collocations would improve clarity and make the vocabulary more appropriate to IELTS Academic Task 1.
Grammatical Range and Accuracy: Band 5.0
You attempt both simple and longer sentence forms, and the main trends can generally be understood. However, control becomes less reliable in the extended sentences. For example, “the number of often visitors were” has subject–verb disagreement, and “which is the lowest … than increased” does not form a complete, well-connected structure. The repeated sequence “than … than …” also creates faulty sentence construction. Capitalisation is inconsistent in “Overall, The number,” and some clauses lack clear punctuation. Practise separating each data point into a controlled clause and checking agreement, tense, and sentence boundaries. A wider range of accurate complex structures would make the report easier to read.
See this exact question answered at other band scores. The same prompt compared across bands.
Browse more IELTS Writing model answers or get your own writing scored by the same AI examiner.