Band 4.5 IELTS Writing Task 1 Model Answer
Overall Band Score: 4.5 · IELTS Academic Practice Accelerator · 2026-11-22
IELTS Writing Task 1 question
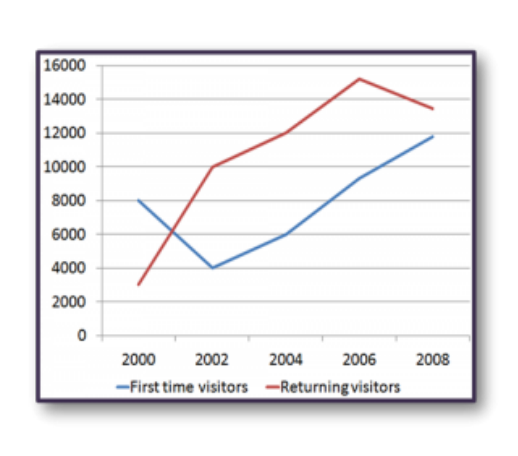
The line graph shows the number of first time visitors and returning visitors who visited Caryl Island from 2000 to 2008.
Summarise the information by selecting and reporting the main features, and make comparisons where relevant.
The line graph shows the number of first time visitors and returning visitors who visited Caryl Island from 2000 to 2008.
Student answer (Band 4.5)
In this graph we can see a visitors ratio of caryl island inthe start of the graph wekan see 8000 people go to this island and returning of people is lessthen go its around 2300 but after 2000- 2004 visitors ar fell down and retarning of pepole is incrase in 2002 visitors 4000 and returning of people number is 10000 day by day it incrise and fist time visitors ar also incrise in 2004 first time visitor number incrase and hitton 6000 and returning vositors also incrase 8000 and last ofthe 2004 it reached 10000 visitors ster ting of 2006 first time vise tor reached 8000 and last of this year it become 10000. returning of vesitor reced onthe first of the year is 12000 and around last of thos year it hitti its alltime higest returning around 15000. it is the higest returning of all time but 2008 it fell dowen in around 13500 and the fist time vissitor become incrase in 12000. that is all what i see in this graph and i explain it
AI examiner evaluation
| Criterion | Band |
|---|---|
| Task Achievement / Task Response | 5.0 |
| Coherence and Cohesion | 4.5 |
| Lexical Resource | 4.5 |
| Grammatical Range and Accuracy | 4.5 |
| Overall | 4.5 |
Task Achievement / Task Response: Band 5.0
You identify the two visitor groups and report several relevant figures, including the fall in first-time visitors to 4,000 in 2002 and the rise in returning visitors to a peak of about 15,000 in 2006. However, the response only partially summarises the graph: it has no clear overview of the main trends, and some comparisons or stages are unclear. For example, you say returning visitors reached 8,000 in 2004, whereas the graph shows about 12,000; you also describe the first-time figure in 2006 as 8,000, rather than approximately 9,300. Focus on the overall pattern—returning visitors rose to a peak then declined, while first-time visitors generally recovered and increased—and select accurate key figures to support it.
Coherence and Cohesion: Band 4.5
The response follows the years broadly from 2000 to 2008 and mentions both visitor categories, so the reader can recognise the intended subject. However, nearly all the information is placed in one long, run-on sequence, with no paragraphing or clear separation of the overview from the details. Connectors such as “and,” “but,” and “also” are repeated, and phrases like “last of the 2004” and “first of the year” make the sequence difficult to follow. Organise the report into a brief overview and one or two detail paragraphs, grouping the two series or comparing them at each stage. Use clear time references and linking phrases selectively.
Lexical Resource: Band 4.5
You use some relevant vocabulary, including “visitors,” “returning,” “incrise,” and “alltime higest,” and attempt to describe movement with phrases such as “fell down” and “hit.” However, the range is limited and many word choices, spellings, and collocations make the account difficult to understand, for example “visitors ratio,” “returning of people,” and “it hitti its alltime higest.” Repeated use of “incrise” also limits precision. Learn a small set of accurate graph terms and use them consistently: “number of visitors,” “rose,” “declined,” “reached a peak,” and “approximately.” Check spelling and choose natural combinations, such as “returning visitors increased,” rather than translating phrases word by word.
Grammatical Range and Accuracy: Band 4.5
You attempt to describe changes over time and include some longer sentences, but the response relies mainly on basic sentence patterns, and many are not controlled. Missing or incorrect sentence boundaries create run-ons, as in “in 2002 visitors 4000 and returning of people number is 10000 day by day it incrise.” Verb forms and agreement are also inconsistent, including “visitors ar fell down” and “it become 10000.” Articles and prepositions are often absent or misplaced. These errors frequently make relationships between figures and time periods hard to follow. Practise writing short, complete sentences with a clear subject and verb, then combine them using accurate clauses and punctuation.
See this exact question answered at other band scores. The same prompt compared across bands.
Browse more IELTS Writing model answers or get your own writing scored by the same AI examiner.