Band 5.5 IELTS Writing Task 1 Model Answer
Overall Band Score: 5.5 · IELTS Summit Mastery · 2026-11-05
IELTS Writing Task 1 question
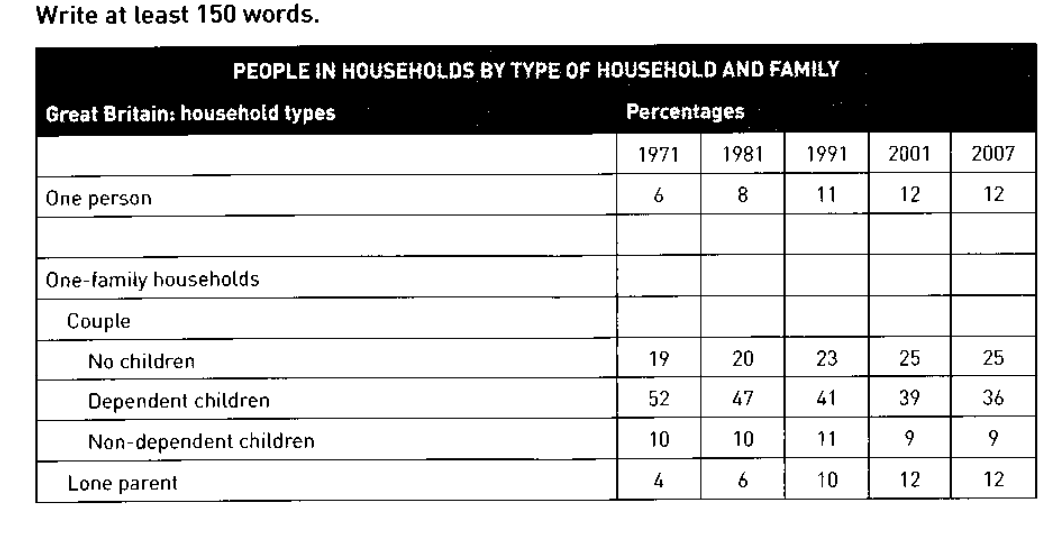
The table below shows the change in some household types in Great Britain from 1971 to 2007.
Summarise the information by selecting and reporting the main features, and make comparisons where relevant.
PEOPLE IN HOUSEHOLDS BY TYPE OF HOUSEHOLD AND FAMILY
Student answer (Band 5.5)
The table illustrates the development in few british household in 1971, 1981, 1991, 2001 and 2007. The household had different categories: one person, and one family. One family household had sub categories of couple, no childern, depenent children, non dependent children and lone parent.
Overall, in 2001 and 2002 one person had the highest percentage in contrast to other years, with 12% in both years. While in one family typ household had the highest percentage of 52% in 1971 ith denpendent chillren. Whereas, lone parent sub type had the lowest percentage of 4% in 1971.
Moreover, in contrast to one person household, one family with dependent children had the highest percentage throughout the years, in 1971 (52%), in 1981 (47%), 1991 (41%), 2001 ( 39%) and 2007 (36%) while it did decrease every year still being the highest in 2007.
However, no children and non dependent children, in no children household from 1971 to 2007 the percentage increased while in non dependent children household the percentage decreased.
AI examiner evaluation
| Criterion | Band |
|---|---|
| Task Achievement / Task Response | 5.0 |
| Coherence and Cohesion | 5.5 |
| Lexical Resource | 5.5 |
| Grammatical Range and Accuracy | 5.5 |
| Overall | 5.5 |
Task Achievement / Task Response: Band 5.0
You identify the main categories and report the key decline in households with dependent children, including the correct figures from 1971 to 2007. You also note that lone-parent households began at the lowest share. However, the overview contains a significant misreading: one-person households did not have the highest percentage in 2001 or 2002; 2002 is not shown, and dependent-child households remained the largest category in every year. The final comparison is also too vague: no-children households rose from 19% to 25%, while non-dependent-child households ended at 9%, after a small rise and subsequent fall. Select and compare these main trends accurately, and make the overview clearly distinguish the largest and smallest categories.
Coherence and Cohesion: Band 5.5
The response has a recognisable structure, with an introduction, an overview and further details, and the dependent-children figures are presented in chronological order. This gives the reader some progression through the data. However, the overview is difficult to follow because it shifts between categories and includes the inaccurate claim about one-person households being highest. The final paragraph combines two trends in a single sentence without giving their figures, so the comparison is not fully developed. Linking words such as “Whereas,” “Moreover,” and “However” are used, but some connections feel mechanical or do not clearly express the relationship between ideas. Organise the body around contrasting trends and use clearer references to each household type.
Lexical Resource: Band 5.5
You use relevant task vocabulary, including “percentage,” “categories,” “dependent children,” and “lone parent,” so the topic is generally clear. There is some variation in describing change, such as “increased,” “decreased,” and “highest.” However, several spelling errors and imprecise phrases weaken clarity: “childern,” “depenent,” and “denpendent” make key labels harder to read, while “development in few british household” is not a natural description of the table. “One family typ household” is also unclear. Use accurate, consistent labels and more precise trend language, such as “the proportion of one-person households” or “rose steadily.” Check spelling carefully, especially for repeated data terms.
Grammatical Range and Accuracy: Band 5.5
You attempt both simple and more complex sentence forms, including a contrast with “While” and a clause beginning “while it did decrease every year.” The main figures and categories can usually be understood, but sentence control is uneven. For example, “The table illustrates the development in few british household” is missing an article and has an unclear noun phrase, while “in 2001 and 2002 one person had the highest percentage” has an inaccurate time reference and awkward structure. The sentence beginning “However, no children and non dependent children” is incomplete and lacks a clear grammatical comparison. Use complete sentences with a clear subject and verb, and check articles, singular/plural forms, and punctuation when joining contrasting clauses.
See this exact question answered at other band scores. The same prompt compared across bands.
Browse more IELTS Writing model answers or get your own writing scored by the same AI examiner.