Band 6.0 IELTS Writing Task 1 Model Answer
Overall Band Score: 6.0 · IELTS Summit Mastery · 2026-11-08
IELTS Writing Task 1 question
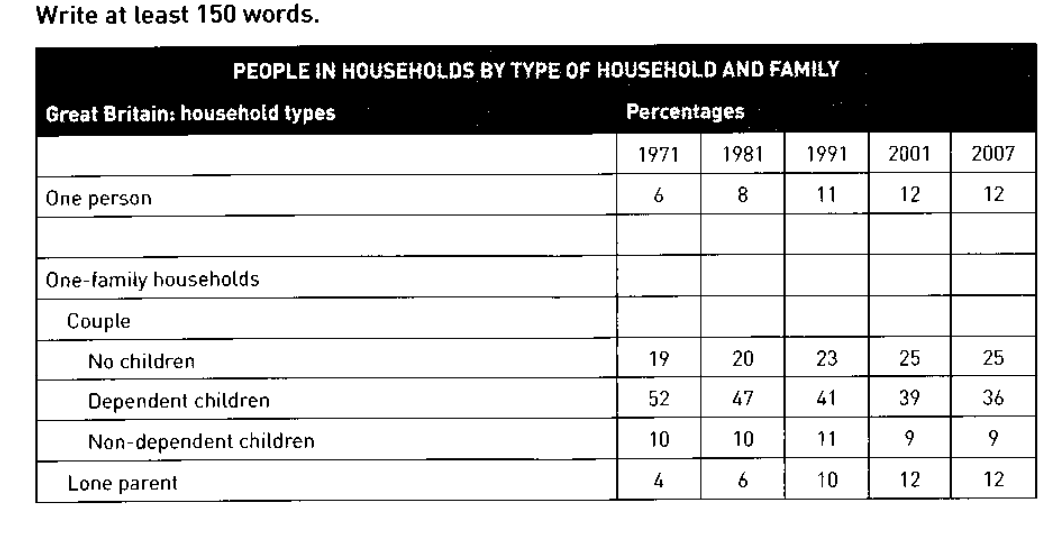
The table below shows the change in some household types in Great Britain from 1971 to 2007.
Summarise the information by selecting and reporting the main features, and make comparisons where relevant.
PEOPLE IN HOUSEHOLDS BY TYPE OF HOUSEHOLD AND FAMILY
Student answer (Band 6.0)
The given table illustrates the change in percentage of various household types in Great Britian from 1971 to 2007.
The table shows the couples living with dependent children have significant decline, from 52% to 36 percent in the time period of 1971 to 2007.The propotion of couples living with non dependent children is slightly declined.It increased from 10 % to 11 percent in 1991 and again showed downfall to 9 percent in 2001 to 2007.And the ratio of household couples living with no children is also increased from 19 percent to 25 percent.The lone parent families also grew from low figure to high figure which is 4 percent to 12 percent by the end of the period.Similarly, in one person fhousehold, the overall figure also grew from 6 percent to 12 percent by the whole time period.
Overall, the household couples with the dependent children and non dependent children showed significant downfall in percentage.On the other hand lone parent and one person household experienced growth in overall time period.
AI examiner evaluation
| Criterion | Band |
|---|---|
| Task Achievement / Task Response | 6.5 |
| Coherence and Cohesion | 6.0 |
| Lexical Resource | 5.5 |
| Grammatical Range and Accuracy | 5.5 |
| Overall | 6.0 |
Task Achievement / Task Response: Band 6.5
You cover the main household categories and report several important changes accurately: dependent-child couples fell from 52% to 36%, while lone-parent and one-person households rose from 4% to 12% and 6% to 12%, respectively. You also identify the rise in couples without children. The overview, however, is not fully precise: it groups non-dependent-child households with the declining categories, although their figures fluctuate and finish only slightly below their starting point (10% to 9%). The largest category throughout—the dependent-child group—is not explicitly identified as such. This response presents relevant data and a clear overall direction, but some comparisons and the overview need sharper selection and development to show the main features more completely.
Coherence and Cohesion: Band 6.0
The response has a recognisable progression: it introduces the table, describes several categories, and ends with an overview. Linking expressions such as “On the other hand” and “Similarly” help signal relationships between trends. However, most of the data discussion is compressed into one long paragraph, making the sequence of comparisons harder to follow. The overview also repeats trends already mentioned rather than synthesising them clearly, and “Similarly” does not establish a particularly clear comparison between lone-parent and one-person households. Group the related increases and decreases into a more deliberate structure, and use references such as “this category” only when their meaning is unmistakable. Overall organisation is coherent, though cohesion is sometimes mechanical or unclear.
Lexical Resource: Band 5.5
You use relevant task vocabulary, including “percentage,” “dependent children,” “lone parent families,” and “overall figure,” so the reader can understand the categories being compared. There is also some attempt to vary trend language with “decline,” “grew,” and “downfall.” However, several choices are inaccurate or unnatural, including “significant downfall,” “low figure to high figure,” and “the ratio of household couples.” Spelling errors such as “Britian,” “propotion,” and “fhousehold” also reduce control. Some repetition of “percentage” and “figure” limits flexibility. Aim for precise, conventional chart language and check spelling carefully; for example, use “proportion” and “increased from … to …” rather than less natural formulations.
Grammatical Range and Accuracy: Band 5.5
You attempt both simple statements and longer sentences that combine several trends, and the main comparisons are generally understandable. However, some sentence structures are difficult to control, particularly the sentence beginning “The propotion of couples living with non dependent children,” where the subject is followed by “is slightly declined” and then a sequence of clauses without clear punctuation. There are also errors in tense and sentence construction, as in “It increased … and again showed downfall,” and missing spaces after full stops make boundaries unclear. Use a consistent past-tense pattern for the historical data, and divide multi-trend sentences into shorter, accurately punctuated comparisons. The range is present, but some errors remain and occasionally make the relationships between ideas less clear.
See this exact question answered at other band scores. The same prompt compared across bands.
Browse more IELTS Writing model answers or get your own writing scored by the same AI examiner.