Band 4.0 IELTS Writing Task 1 Model Answer
Overall Band Score: 4.0 · IELTS Summit Mastery · 2026-11-09
IELTS Writing Task 1 question
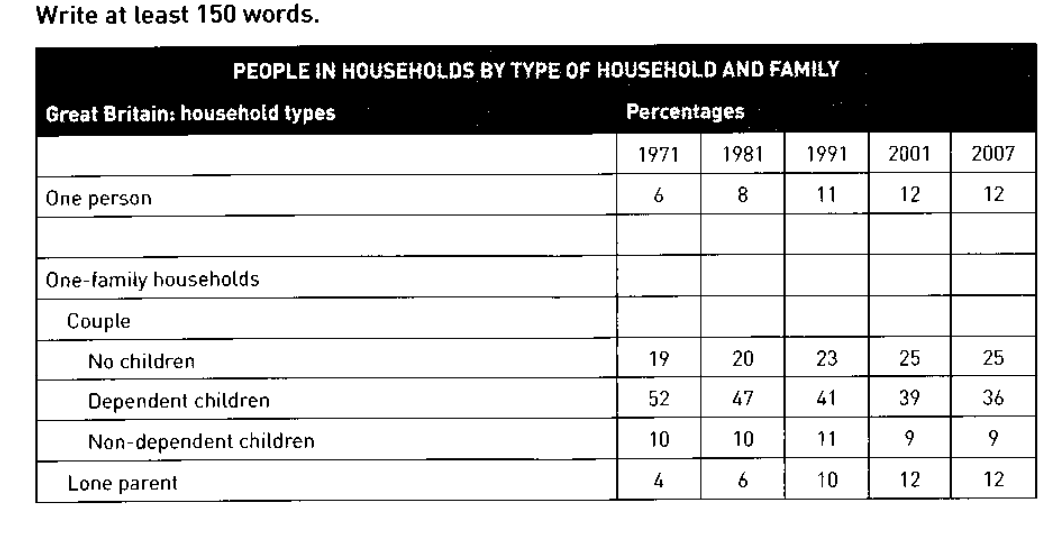
The table below shows the change in some household types in Great Britain from 1971 to 2007.
Summarise the information by selecting and reporting the main features, and make comparisons where relevant.
PEOPLE IN HOUSEHOLDS BY TYPE OF HOUSEHOLD AND FAMILY
Student answer (Band 4.0)
The given table illustrates thepeople that change the house types inthe great britian between the two years from 1971 to 2007it show the percentages. the percentage of dependent childern was increase trhan yhe others.
Firstly, Theone person that lived in ahousehold in the 1971 year was only six percent. and in the next year in 1981 the percentage was eight percentwhile in the 1991 itwas11 percent after that it was slightly increase 12percent in 2001 and 2007 it was same in both years.
Moreover in the table the percentage of onefamliy household and the couple famliy house hold was not given in the table.
secondly, No childern household percentage of the 1971 and 1981 year it was ninteen and and take one percent increase in on other year. in 1991 to 2001 and 2007 percentage was 23percent and 25 percent and in other year was 12 percentwhile the percentage of dependent and nondependent house hold in 1971 and 1981 was fiftytwo and fortyseven percent and in the other year the two year percentage was ten percent. i
AI examiner evaluation
| Criterion | Band |
|---|---|
| Task Achievement / Task Response | 3.5 |
| Coherence and Cohesion | 4.0 |
| Lexical Resource | 4.5 |
| Grammatical Range and Accuracy | 4.5 |
| Overall | 4.0 |
Task Achievement / Task Response: Band 3.5
The response attempts to report several categories and includes some accurate figures, such as the rise in one-person households from 6% to 12% and the fall in dependent-child households from 52% to 36%. However, the overview is unclear and even says dependent children increased, which reverses the main trend. Several figures are misreported or confused: the no-children category is described as reaching 12%, while the final figures for non-dependent children and lone-parent households are not accurately presented. The statement that some household data were “not given” is also incorrect, since all listed categories have values. To make the report more effective, identify the main rises and falls accurately and compare the categories using the table’s figures.
Coherence and Cohesion: Band 4.0
There is a basic attempt to organise the response, with an opening, sequencing words such as “Firstly” and “Moreover,” and some chronological reporting. The one-person figures are presented in time order, which helps the reader follow that section. However, the response does not develop a clear overall progression: it shifts between categories, and the paragraph beginning “secondly” combines several household types and years in a confusing way. Some linking phrases do not show the relationship between ideas clearly, and the final sentence is incomplete. Grouping the main increases together and the main decreases together, with one paragraph for each, would make the comparisons easier to follow.
Lexical Resource: Band 4.5
The response uses a small range of task-related vocabulary, including “percentage,” “household,” “increase,” and “dependent,” so the topic is generally recognisable. However, word choice and spelling are often inaccurate or repetitive, as in “thepeople that change the house types,” “childern,” and “famliy.” Some phrases are difficult to interpret, including “take one percent increase in on other year,” and “the two year percentage was ten percent” does not clearly identify the category or years. Use standard forms such as “household types” and “children,” and choose precise reporting verbs such as “rose,” “fell,” and “remained stable.” This would improve clarity and make the vocabulary more suitable for describing data.
Grammatical Range and Accuracy: Band 4.5
The response attempts both simple statements and longer sentences, and the sequence describing one-person households shows an effort to connect changes across several years. However, sentence boundaries and basic grammatical forms are frequently inaccurate. For example, “the percentage of dependent childern was increase” has an incorrect verb construction, while “in the 1971 year was only six percent” lacks a clear grammatical subject. Capitalisation and punctuation are also inconsistent, and several clauses run together without clear separation. These problems make parts of the report difficult to understand. Practise forming complete sentences with a clear subject and verb, and use consistent past-tense forms when describing the historical figures.
See this exact question answered at other band scores. The same prompt compared across bands.
Browse more IELTS Writing model answers or get your own writing scored by the same AI examiner.