Band 5.0 IELTS Writing Task 1 Model Answer
Overall Band Score: 5.0 · IELTS Summit Mastery · 2026-11-09
IELTS Writing Task 1 question
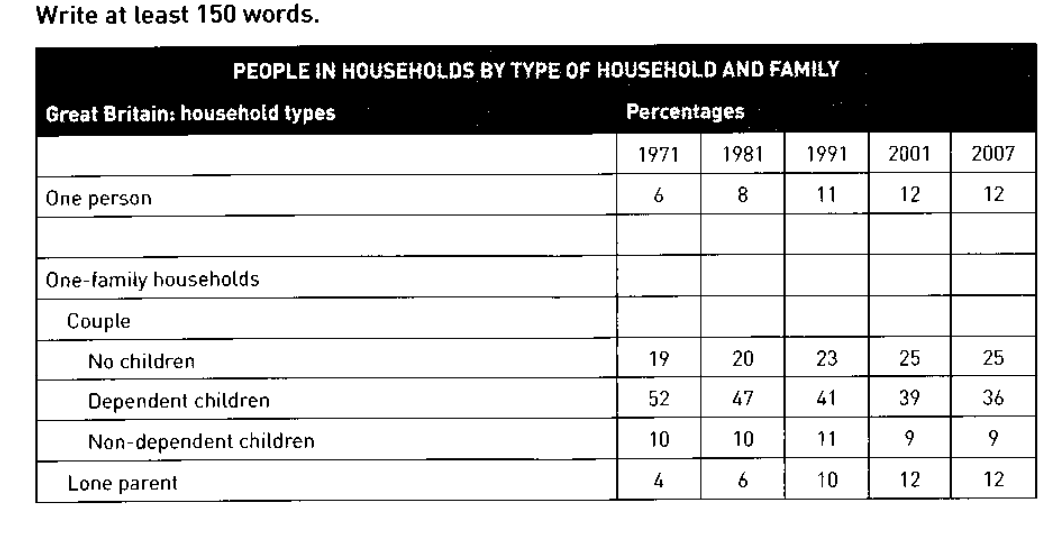
The table below shows the change in some household types in Great Britain from 1971 to 2007.
Summarise the information by selecting and reporting the main features, and make comparisons where relevant.
PEOPLE IN HOUSEHOLDS BY TYPE OF HOUSEHOLD AND FAMILY
Student answer (Band 5.0)
The table below illustrates the change in some household types in great britan from 1971 to 2007. There are some changes can be noticed peoples in households by the type of household and family.
Starts from one person, in 1971 there is 6% people in household by type of household and family, 1981 the percentage is increased to 8%, 1911 the percentage is further increases to 11%, and in both 2001 and 2007 there is no change in percentage the percentage is 12% in both year.
In one family households, there are couple thats who have no children the rate in 1971 is 19%, 1981 the rate increased to 20%, 1991 the rate increased to 23%, and the result is same 25% in both year 2001 and 2007. The dependent children there is too much rate 52% in 1971, 1981 the rate decrease 5% and come to 47%, 1991 the rate also decrease to 41% , 2001 the rate decrease to 39% and in 2007 the rate further decreases to 36%. The rate of non_dependent children is 10 % in 1971, there are same result in 1981, the rate increased in 1991 and comes to 11%, and in 2001 and 2007 they are same result 9%.
The rate of lone parent is 4% in 1971, rate increased to 6% in 1981, 1991 the rate is 10% , and they also have same result in 2001 and 2007 that's 12%
AI examiner evaluation
| Criterion | Band |
|---|---|
| Task Achievement / Task Response | 4.5 |
| Coherence and Cohesion | 5.5 |
| Lexical Resource | 5.0 |
| Grammatical Range and Accuracy | 5.0 |
| Overall | 5.0 |
Task Achievement / Task Response: Band 4.5
You report all five household categories and give many figures accurately, including the rise in one-person households from 6% to 12% and the fall in households with dependent children from 52% to 36%. However, the response mainly lists figures rather than selecting and summarising the most important features. It lacks a clear overview of the broad pattern—for example, that dependent-child households remained the largest category despite declining, while several other types increased. There is also a factual error: “1911” should be 1991. Some descriptions, such as “there is too much rate,” do not explain the significance of the data. A concise overview and clearer emphasis on the main contrasts would make the response more complete.
Coherence and Cohesion: Band 5.5
The response is arranged in a generally understandable sequence: it discusses one-person households first, then the one-family categories, and follows the years in chronological order. This helps readers locate the figures. However, the organisation is largely a series of long, repetitive lists, with no separate overview to establish the main trends before the details. Linking is often mechanical, especially the repeated use of “the rate increased” and “the rate decreased,” while some connections are unclear, as in “there are couple thats who have no children.” Use a clear introduction and overview, then group related trends into focused paragraphs. Varying transitions and avoiding repeated sentence patterns would improve progression.
Lexical Resource: Band 5.0
You use relevant basic terms such as “percentage,” “increased,” “decreased,” and the household-category labels, so the data is usually identifiable. However, vocabulary is limited and repetitive, and several choices are unnatural or imprecise: “too much rate” does not suit a percentage description, and “same result” is repeated where “remained unchanged” would be clearer. “The rate of lone parent” is also an awkward way to describe the category. Spelling and written forms need attention, including “great britan,” “thats,” and “non_dependent.” Build a more precise range for describing trends and comparisons, and use the table’s category labels consistently.
Grammatical Range and Accuracy: Band 5.0
The response communicates most figures through simple clauses, but sentence structures are repetitive and attempts to combine several points often produce errors. For example, “There are some changes can be noticed” lacks a grammatical link between the clauses, and “the percentage is further increases” combines incompatible verb forms. There are also problems with articles, agreement, and number, as in “in both year” and “there is no change in percentage the percentage is 12%.” Punctuation is weak in several long sentences, making the sequence of figures harder to follow. Practise accurate past-tense reporting and use shorter, well-punctuated sentences alongside simple comparisons.
See this exact question answered at other band scores. The same prompt compared across bands.
Browse more IELTS Writing model answers or get your own writing scored by the same AI examiner.