Band 5.0 IELTS Writing Task 1 Model Answer
Overall Band Score: 5.0 · IELTS Summit Mastery · 2026-11-11
IELTS Writing Task 1 question
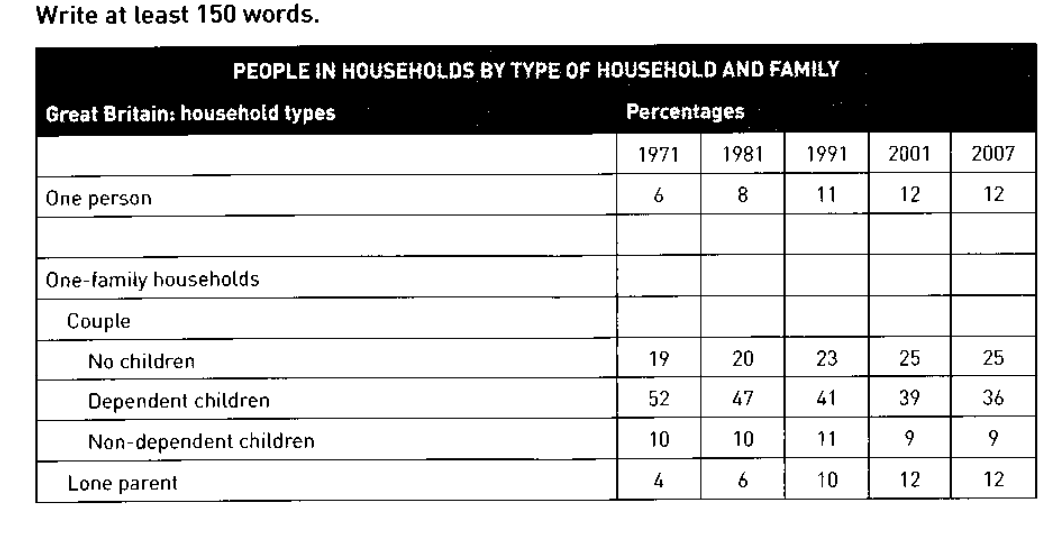
The table below shows the change in some household types in Great Britain from 1971 to 2007.
Summarise the information by selecting and reporting the main features, and make comparisons where relevant.
PEOPLE IN HOUSEHOLDS BY TYPE OF HOUSEHOLD AND FAMILY
Student answer (Band 5.0)
The tabular chart depicts the information regarding the changes in some households types in Great Britian from 1971 to 2007
Overall, It is crystal clear that maxium percentile of change was seen in couple with dependent children. Whereas, minium change was seen in household of lone parents
It is apparent from the chart that in 1971 there was 6% of one person in a household. Whereas, In 2001 the percentage rise up to 12%. Furthermore, In 2007 there was no change seen in the change of percentage. Movingfurther, In 1971 there was 19% percentage of couple with no children and in 2007 it raised upto 25%. Moreover, Couple with dependent children in 1971 the percentum of dependent childen living in household was at 52 and in 2007 the pecentile moved downwards to 36%
Moving ahead, In 1971, the non dependent children's living the pecentile ws at 10% and in 2007 it was at 95% . more, Thelone parents living in house holds in 1971 was at 4% and in 2007 the percentile raised up to 12% respectively
AI examiner evaluation
| Criterion | Band |
|---|---|
| Task Achievement / Task Response | 5.0 |
| Coherence and Cohesion | 5.5 |
| Lexical Resource | 5.0 |
| Grammatical Range and Accuracy | 5.0 |
| Overall | 5.0 |
Task Achievement / Task Response: Band 5.0
You identify several relevant categories and report the broad direction of change, including the fall in households with dependent children and rises in one-person and lone-parent households. However, the overview is unclear and partly inaccurate: dependent-child households had the largest change, but lone-parent households did not show the smallest change; non-dependent-child households changed less. The figure “95%” for non-dependent children is incorrect—the table shows 9% in 2007—and this substantially misrepresents the data. The response also focuses mainly on the first and last years, with little comparison of the intermediate figures or a clear summary of the main patterns. Select the most important trends accurately and give a concise, data-based overview.
Coherence and Cohesion: Band 5.5
The response has a basic sequence: an introduction, an overview, and then details about several household types. This gives the reader some sense of the task’s structure. However, progression within the detail section is uneven, and the repeated use of “Whereas,” “Furthermore,” “Moreover,” and “Moving ahead” makes the linking feel mechanical rather than showing clear relationships between figures. Some sentences combine several facts without a clear comparison, while the final sentence is difficult to follow. Group related trends—for example, categories that rose together—and use straightforward links such as “by contrast” or “over the period.” Clearer sentence boundaries and paragraphing would make the comparisons easier to track.
Lexical Resource: Band 5.0
You use some task-related vocabulary, including “percentage,” “household,” “dependent children,” and “rose,” so the topic is generally recognisable. However, the range is limited and several word choices or forms are inaccurate or unnatural, such as “percentum,” “percentile” for a percentage, “the change of percentage,” and “the non dependent children's living.” Spelling errors including “Britian,” “maxium,” and “pecentile” also reduce precision. These problems sometimes make the data harder to understand, especially in the sentence reporting 95%. Use standard chart language consistently: “accounted for,” “the proportion,” “increased to,” and “fell to.” Check spelling and avoid repeating “percentage” when a more precise noun is available.
Grammatical Range and Accuracy: Band 5.0
You attempt both simple statements and longer sentences with time references, but the range is limited and complex attempts are often faulty. For example, “in 1971 there was 6% of one person in a household” has an awkward grammatical construction, while “Couple with dependent children in 1971 the percentum…” lacks a clear subject and verb structure. There are also recurring problems with articles, plurals, agreement, and sentence boundaries, as in “some households types” and the run-on final section. These errors can make relationships between categories and years difficult to follow. Build each comparison around a clear subject and verb, such as “The proportion of one-person households rose from 6% to 12%,” and punctuate each complete idea separately.
See this exact question answered at other band scores. The same prompt compared across bands.
Browse more IELTS Writing model answers or get your own writing scored by the same AI examiner.