Band 5.5 IELTS Writing Task 1 Model Answer
Overall Band Score: 5.5 · IELTS Summit Mastery · 2026-11-11
IELTS Writing Task 1 question
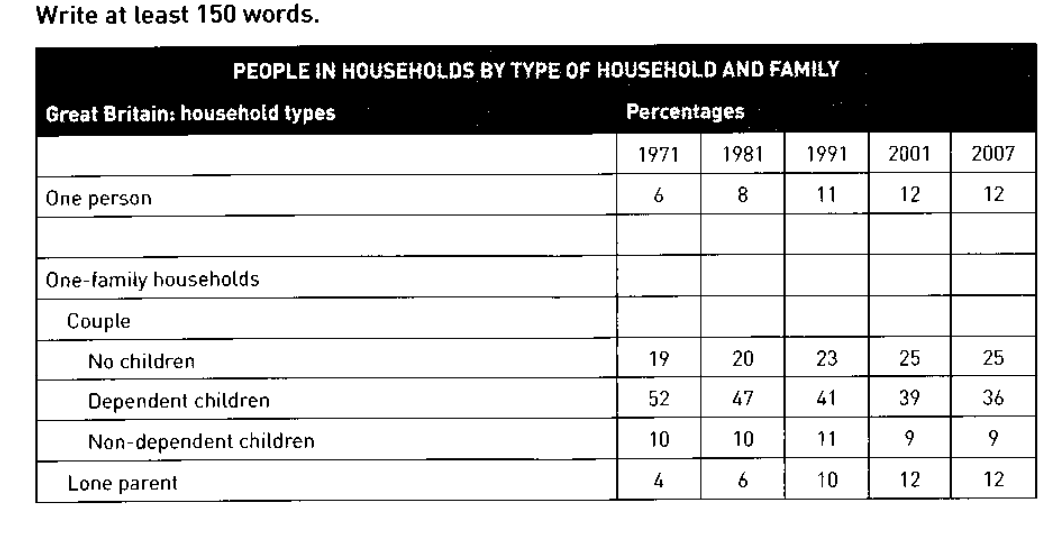
The table below shows the change in some household types in Great Britain from 1971 to 2007.
Summarise the information by selecting and reporting the main features, and make comparisons where relevant.
PEOPLE IN HOUSEHOLDS BY TYPE OF HOUSEHOLD AND FAMILY
Student answer (Band 5.5)
The table-chart tracks the information about the changes in Great Britian households of individuals by households types; which comprises of three following types, expressed in the percentages, between 1971 till 2007.
Overall, a one person in Great Britain increased by 12% till 2007 which was only 6% in 1971, while the couple having no children and the lone parent households were increased drastically.
The table eloborates the percentages of households by years; 1971, 1981,1991,2001 and 2007. One person household were 6% which changed after every 10 years by 2% by 2001 which remained the same till 2007.
However, one family households of different type of couple are categorise in the chart; couple having no children were 19% which rose by 1-2% till 2001 around 25% which remained the same in 2007. The couple with dependent children were 52% in which a decreased can be seen ehich was about 36%, whereas the couple having non-dependent children were having 10% households which were only decreased by 1% in all these years till 2007 with slight increased in between 1991.
Furthermore, lone parent households were 4% in which a drastic change can elicitly shows the rise by 12% in 2007.
AI examiner evaluation
| Criterion | Band |
|---|---|
| Task Achievement / Task Response | 6.0 |
| Coherence and Cohesion | 6.0 |
| Lexical Resource | 5.5 |
| Grammatical Range and Accuracy | 5.0 |
| Overall | 5.5 |
Task Achievement / Task Response: Band 6.0
You identify several important trends accurately: the one-person share rises from 6% to 12%, couples without children increase from 19% to 25%, and dependent-child households decline from 52% to 36%. The overview also highlights the rise in lone-parent households, which reaches 12%. This gives the response a relevant summary of the table. However, the overview is not fully precise: saying one-person households “increased by 12%” confuses the final figure with the size of the increase, which is 6 percentage points. Some details are also underdeveloped, particularly the non-dependent-child category, whose figures rise to 11% in 1991 before falling to 9%. A clearer overview of the largest and most consistent changes, with precise comparisons, would strengthen the report.
Coherence and Cohesion: Band 6.0
The response has a recognisable structure: an introduction, an overview, and paragraphs describing the household categories. Sequencing is generally understandable, and transitions such as “However” and “Furthermore” help signal shifts in focus. However, cohesion is sometimes mechanical or unclear. The opening sentence is difficult to follow, and “which comprises of three following types” does not clearly explain how the categories are organised. The long paragraph beginning “However, one family households…” combines several trends, making comparisons harder to track. Some references, such as “which changed after every 10 years by 2%,” require the reader to infer what “which” refers to. Use shorter, clearly focused paragraphs and connect each figure directly to its category.
Lexical Resource: Band 5.5
You use relevant vocabulary for describing data, including “increased,” “decreased,” “rose,” “remained the same,” and “drastic change.” This provides an adequate range for the task, and the main trends are usually understandable. However, several word choices and collocations are inaccurate or awkward, such as “table-chart,” “households of individuals by households types,” and “a decreased can be seen.” There are also spelling errors, including “Britian,” “eloborates,” and “ehich,” which reduce the overall accuracy. Some expressions, such as “change can elicitly shows,” are difficult to interpret. Aim for precise, conventional data-reporting language and check spelling and word forms carefully; this will make your comparisons clearer and more natural.
Grammatical Range and Accuracy: Band 5.0
You attempt both simple and more complex sentences, including clauses introduced by “while” and “whereas,” and the overall meaning can usually be followed. However, errors in sentence structure and agreement occur in several places. For example, “a one person in Great Britain increased” has an unclear subject, while “one person household were 6%” does not match singular and plural forms. The sentence beginning “The couple with dependent children were 52% in which a decreased can be seen” is also structurally difficult to follow. Articles, plurals, and punctuation need more consistent control, as in “one family households of different type.” Build each sentence around a clear subject and verb, and check agreement and clause boundaries before finalising.
See this exact question answered at other band scores. The same prompt compared across bands.
Browse more IELTS Writing model answers or get your own writing scored by the same AI examiner.