Band 5.5 IELTS Writing Task 1 Model Answer
Overall Band Score: 5.5 · IELTS Summit Mastery · 2026-11-11
IELTS Writing Task 1 question
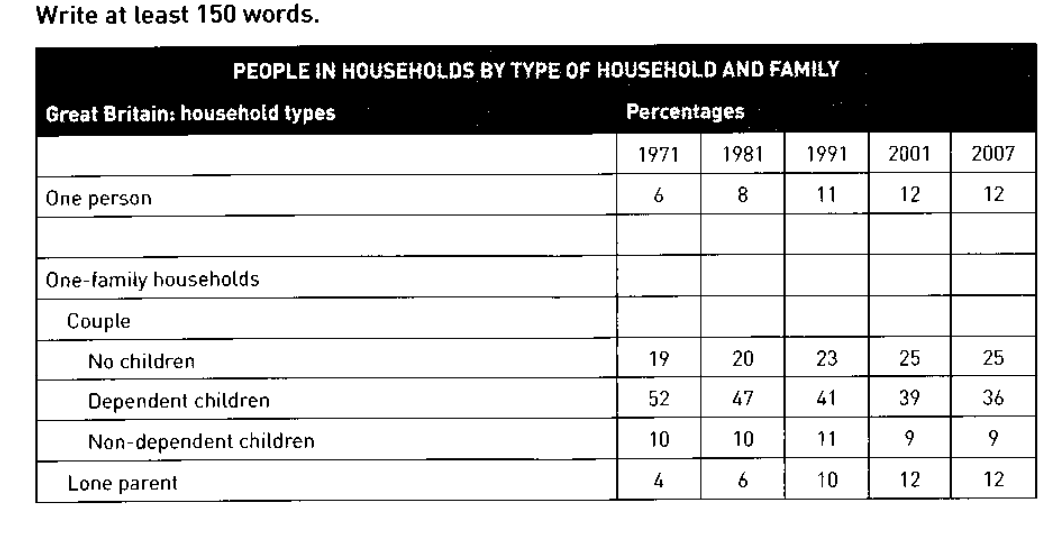
The table below shows the change in some household types in Great Britain from 1971 to 2007.
Summarise the information by selecting and reporting the main features, and make comparisons where relevant.
PEOPLE IN HOUSEHOLDS BY TYPE OF HOUSEHOLD AND FAMILY
Student answer (Band 5.5)
The table illustrates the variation in different households by percentages in Great Britain, between 1971 and 2007.
Overall, various household in Great Britain consist of one person, family, couple, no children, dependent and non-dependent children, and lone parents.
In 1971, rate of dependent children were highest of all that is 52, which then decreases to 36 in 2007. Nonetheless, in mid three decades the percentage was 47%, 41%, and 39%. Moving toward one person household type, it started from 6% in 1971 then 8% in 1981 and rose upto 11 in 1991 and remained same in 2001 and 2007 that accounted for 12%. In the last two years, couple with no childrens were consist of 25%. However, it was 19% in 1971, 20% in 1981 and 23% in 1991. In one-family household, percentage of non-dependent children were 10 in first two given decades and rose to 11% in 1991 but it was constant in 2110 and 2007 that was of 9%.
At the end, the lone parent percentage rate same costant in 2001 and 2007 but it was 4% in 1971 increased to 6% after ten years and reached upto 10% in 1991.
AI examiner evaluation
| Criterion | Band |
|---|---|
| Task Achievement / Task Response | 5.0 |
| Coherence and Cohesion | 5.5 |
| Lexical Resource | 5.5 |
| Grammatical Range and Accuracy | 5.0 |
| Overall | 5.5 |
Task Achievement / Task Response: Band 5.0
You report several relevant figures accurately, including the fall in households with dependent children from 52% to 36%, and the rise in one-person households from 6% to 12%. However, the overview mainly lists household categories rather than identifying the key overall patterns. The response also gives limited comparison across the categories, and the final lone-parent trend is not completed: it says the figure was constant in 2001 and 2007 but does not state that it reached 12%. The reference to “2110” is inaccurate; the table shows 2001. To strengthen the response, give a concise overview of the dominant decline and the categories that rose, then select and compare the most significant figures accurately.
Coherence and Cohesion: Band 5.5
The response has a basic sequence, moving from dependent children to one-person households, couples without children, non-dependent children and lone parents. Time markers such as “In 1971” and “At the end” help the reader follow the data. However, the overview does not establish a clear organising principle, and the body reads largely as a list of categories rather than a progression of related comparisons. Some linking expressions are awkward or do not show a clear relationship, such as “Nonetheless” before the intermediate figures and “However” before the historical figures for couples. Group the categories with similar trends and use transitions that explicitly signal contrast or change.
Lexical Resource: Band 5.5
You use relevant task vocabulary, including “percentage,” “dependent children,” “one-person household” and “lone parent,” so the topic is generally clear. There is some variety in language for change, such as “decreases,” “rose” and “increased.” However, several word choices and collocations are inaccurate or unnatural, including “variation in different households,” “rate of dependent children,” “were consist of” and “percentage rate same costant.” Spelling and form errors such as “childrens” and “costant” also reduce precision. Aim for standard data-reporting phrases, for example “the proportion of households with dependent children” and “the figure remained stable,” and check spelling and word forms carefully.
Grammatical Range and Accuracy: Band 5.0
You attempt both simple statements and longer sentences with time clauses, as in “which then decreases to 36 in 2007” and “it started from 6% in 1971 then 8% in 1981.” However, the longer constructions are often faulty, and errors in agreement, tense, articles and sentence structure occur frequently. Examples include “various household … consist,” “rate … were highest,” and “couple with no childrens were consist of 25%.” The phrase “it was constant in 2110 and 2007” also combines an incorrect year with an unclear grammatical reference. Use a consistent past tense for the historical data and build shorter, complete sentences with clear subjects and verbs before attempting more complex comparisons.
See this exact question answered at other band scores. The same prompt compared across bands.
Browse more IELTS Writing model answers or get your own writing scored by the same AI examiner.