Band 5.5 IELTS Writing Task 1 Model Answer
Overall Band Score: 5.5 · IELTS Summit Mastery · 2026-11-12
IELTS Writing Task 1 question
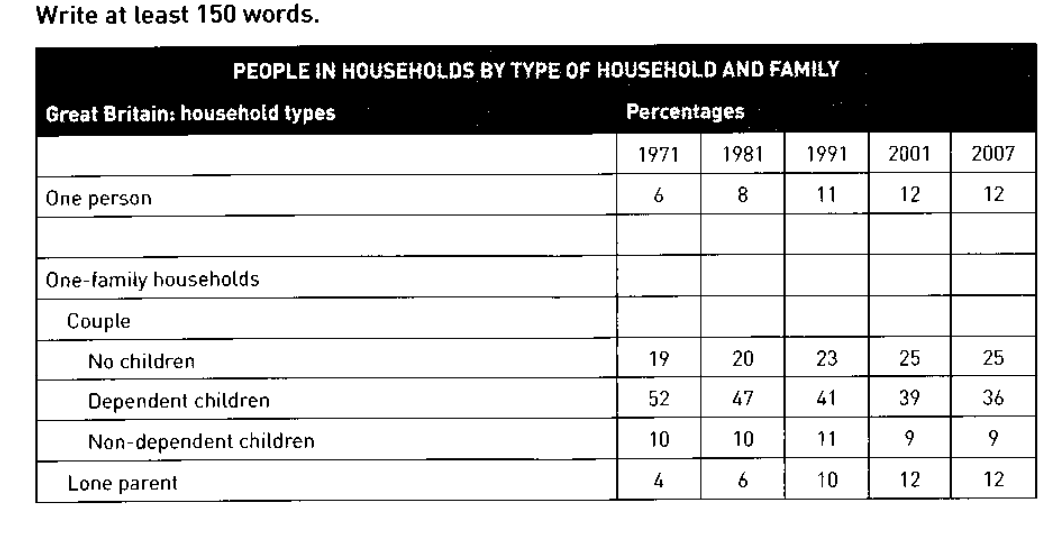
The table below shows the change in some household types in Great Britain from 1971 to 2007.
Summarise the information by selecting and reporting the main features, and make comparisons where relevant.
PEOPLE IN HOUSEHOLDS BY TYPE OF HOUSEHOLD AND FAMILY
Student answer (Band 5.5)
The table compares change in some in some domestic types in Great Britain from 1971 to 2007 .
Overall, in single person shows the highest percentage in final year and no children marked least percent in first year .
An analysis of the table shows that no person in 1971 it is only 6 percent this figure gradually rose to 12% by year 2007.In terms of no kids category 19% in 1971 by the year 2001 and 2007 it maintained same percentage 25% .
Dependent children it is 52% in 1971 this percentage fell sharply to 36 by 2007 .
An evident of the image proven that non dependend children it as been recorded as decreased trend in the given time period 10% in 1971 and 9% in 2007 .Single parent this is marked as increase trend in 1971 it is 4% by 2007 it is increased to 12% percent respectively
AI examiner evaluation
| Criterion | Band |
|---|---|
| Task Achievement / Task Response | 5.5 |
| Coherence and Cohesion | 5.5 |
| Lexical Resource | 5.0 |
| Grammatical Range and Accuracy | 5.0 |
| Overall | 5.5 |
Task Achievement / Task Response: Band 5.5
You report several relevant trends, including the rise in one-person households from 6% to 12%, the fall in households with dependent children from 52% to 36%, and the increase in lone-parent households from 4% to 12%. However, the overview is unclear and partly inaccurate: “no children marked least percent in first year” is not correct, since lone-parent households were lower at 4%, and one-person households were not the highest category in 2007; dependent-child households remained highest at 36%. The response also omits the non-dependent category’s 1991 peak and gives limited comparisons. It is 143 words, below the 150-word minimum. A clearer overview and more accurate selection of key features would strengthen coverage of the task.
Coherence and Cohesion: Band 5.5
The response has a basic paragraph structure: an introduction, an overview, and two paragraphs describing figures. This gives the reader some organisation, and the categories are generally discussed in a sensible order. However, progression is weakened by unclear or incomplete sentence links, such as “An analysis of the table shows that no person in 1971 it is only 6 percent,” where the relationship between the subject and the figure is difficult to follow. Several ideas are joined without adequate punctuation, and the final paragraph shifts between categories with little signposting. Use complete sentences and clearer transitions, and group related increases and decreases together. This would make the information easier to follow rather than presenting it as a sequence of loosely connected observations.
Lexical Resource: Band 5.0
You use some relevant vocabulary for describing data, including “gradually rose,” “fell sharply,” and “maintained same percentage.” These choices show an attempt to vary the language of trends. However, the range is limited and several expressions are inaccurate or awkward, such as “domestic types,” “no kids category,” and “an evident of the image proven.” There are also spelling and word-form problems, including “dependend” and “it as been recorded.” Repeated use of “percentage” and “increase trend” makes the description less precise. Choose standard chart language and check collocations and spelling; for example, refer to “household types” and say a figure “increased” or “declined.”
Grammatical Range and Accuracy: Band 5.0
The response attempts a few different sentence forms, including an overview and clauses describing changes over time, but most sentences rely on simple patterns and several are difficult to interpret because of grammatical errors. For example, “in single person shows the highest percentage” lacks a clear grammatical subject, while “no person in 1971 it is only 6 percent” combines clauses without a suitable structure. Tense and agreement are also inconsistent, as in “this percentage fell” alongside “it is 52%,” and punctuation is often missing after figures and at sentence boundaries. Practise forming complete subject–verb sentences, using past tense consistently for the historical data, and separating clauses with appropriate punctuation.
See this exact question answered at other band scores. The same prompt compared across bands.
Browse more IELTS Writing model answers or get your own writing scored by the same AI examiner.