Band 5.0 IELTS Writing Task 1 Model Answer
Overall Band Score: 5.0 · IELTS Summit Mastery · 2026-11-12
IELTS Writing Task 1 question
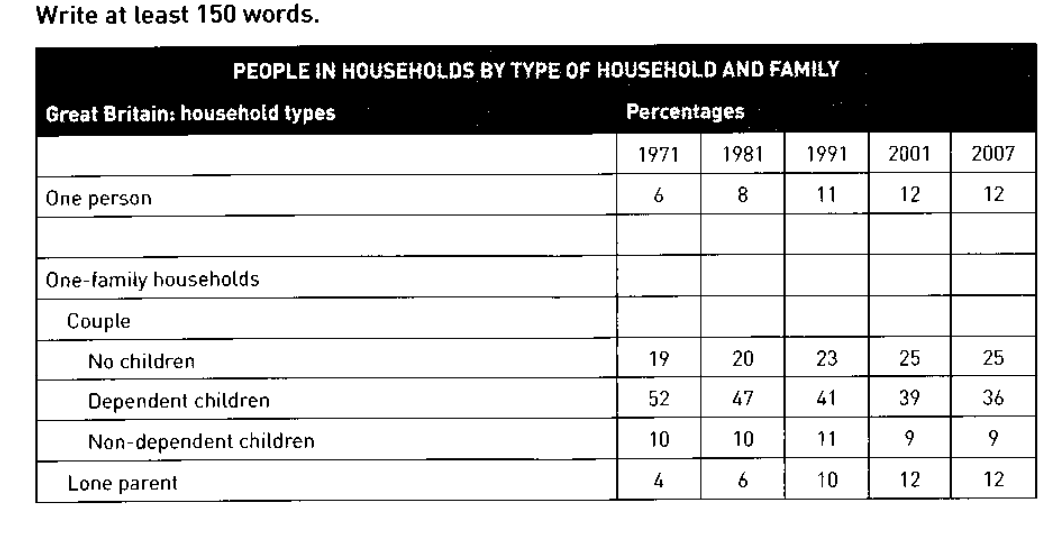
The table below shows the change in some household types in Great Britain from 1971 to 2007.
Summarise the information by selecting and reporting the main features, and make comparisons where relevant.
PEOPLE IN HOUSEHOLDS BY TYPE OF HOUSEHOLD AND FAMILY
Student answer (Band 5.0)
The table graph illustrate the various exchange in many household types in Great Britain between 1971 and 2007.
Looking from an overall perspective it is readily apparent that the maximum replacement in household in dependent children, while lowest in alone parent in the given time period.
Turning towards the detail, in 9171, the percentage of one person household was increase twice in2001 and 2007, which was 6% to 12%. Moreover, it was 8% and 11% in 1981,1991. One family households and couple was not doing any household over the period. Wheras, the percantage of no children was 19% in 1971, which was increase with the time and reach at 25% in 2007.
Moving further, in 1971, the percantage of households of dependent children was highest at 52%, but it was drop down with the time period at 36% in 2007. Furthermore, non dependent children was same in 1971,1981 and 2001,2007. Which was 10% and 9%, but in 1991 it was 11% of household type. 12% of household type of alone parent in 2001 and 2007, while it was also the lowest household in 1971 at 4%, which was increase 2% in 1981 and 6% in 1991.
AI examiner evaluation
| Criterion | Band |
|---|---|
| Task Achievement / Task Response | 5.0 |
| Coherence and Cohesion | 5.5 |
| Lexical Resource | 5.0 |
| Grammatical Range and Accuracy | 5.0 |
| Overall | 5.0 |
Task Achievement / Task Response: Band 5.0
You identify several important patterns, including the rise in one-person households from 6% to 12%, the increase in couples without children to 25%, and the fall in households with dependent children from 52% to 36%. However, the overview is unclear and partly inaccurate: dependent-child households had the largest change, not the “maximum replacement,” while lone-parent households were not the lowest throughout the period, since one-person households were lower in 1971. The statement that “one family households and couple was not doing any household” also misrepresents the table; these categories have figures, and “couple” is a heading for subcategories. Some comparisons are reported, but the main features are not consistently selected or clearly explained. A more precise overview and accurate treatment of the table’s categories would strengthen the response.
Coherence and Cohesion: Band 5.5
The response has a basic paragraph structure: an introduction, an overview, and two paragraphs of details. It also attempts to guide the reader with phrases such as “Turning towards the detail” and “Moving further.” However, progression within the detail paragraphs is sometimes difficult to follow because figures and years are presented in an awkward order, and some links do not clearly show how ideas relate. For example, “Furthermore, non dependent children was same…” is followed by a sentence fragment beginning “Which was…”. The repeated use of “Moreover,” “Furthermore,” and “while” does not always create clear connections. Grouping the rising categories together and the declining category separately, with each trend described in chronological order, would make the organisation more coherent.
Lexical Resource: Band 5.0
You use some task-related vocabulary, including “percentage,” “household type,” and “dependent children,” and you attempt to describe change with words such as “increase” and “drop down.” However, the range is limited and several choices are inaccurate or unnatural, sometimes making the meaning difficult to understand. “Table graph” is not an appropriate description, and “maximum replacement” does not convey the largest change. Phrases such as “alone parent” and “was not doing any household” are also unclear. Spelling errors, including “percantage” and “Wheras,” further reduce precision. Use standard terms for the categories and a small set of accurate trend expressions, such as “rose,” “remained stable,” and “declined,” rather than forcing less suitable wording.
Grammatical Range and Accuracy: Band 5.0
You attempt both simple and longer sentences, but grammatical errors are frequent and sometimes make relationships between figures unclear. Examples include “The table graph illustrate,” where the subject and verb do not agree, and “the percentage … was increase,” which uses an incorrect verb form. In “it was drop down,” the past-tense form is also faulty. There are problems with articles, plurals, and sentence boundaries, as in “Which was 10% and 9%,” an incomplete sentence referring back to the previous clause. Punctuation and spacing around years are inconsistent as well. Practise forming clear past-tense comparisons, for example, “The proportion rose from 6% in 1971 to 12% in 2001 and remained at that level in 2007,” and check each sentence for a complete subject and verb.
See this exact question answered at other band scores. The same prompt compared across bands.
Browse more IELTS Writing model answers or get your own writing scored by the same AI examiner.