Band 5.5 IELTS Writing Task 1 Model Answer
Overall Band Score: 5.5 · IELTS Summit Mastery · 2026-11-12
IELTS Writing Task 1 question
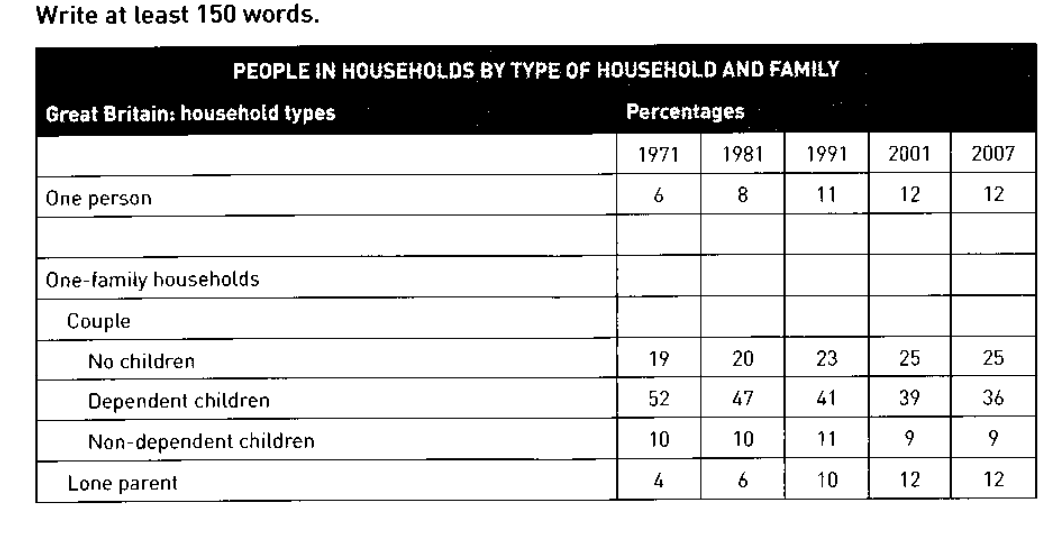
The table below shows the change in some household types in Great Britain from 1971 to 2007.
Summarise the information by selecting and reporting the main features, and make comparisons where relevant.
PEOPLE IN HOUSEHOLDS BY TYPE OF HOUSEHOLD AND FAMILY
Student answer (Band 5.5)
The table demostrate, that how family household types changes, from 1971 to 2007, in Great Britain.
Overall, the graph compares household types and the number of indiviual living in a house along a time period. Variety of household, such as, single-person and family-households: no-children, dependent-children, working children and old-parent only.
In 1971, first, dependent children family are higgest in number. 52%, children are dependent on their family. Second type which are in majority after dependent children are family with no child, 19%, Family with zero child. Non-dependent children family population is less about 10% and 4%, Old parent are few in number .In contrast with modern time 2007 shows visible change. one-person figure represnt continous increase of 2% from 6% until it reaches 12%, likewise, non-dependent chidren and lone parent show same pattern of changes.
Similarly family with no children remain stable with little changes in its percentage 19%,20%,23%,25% from 1971 to 2007, while, dependent-children is the only one type, that decreases to 36%.
AI examiner evaluation
| Criterion | Band |
|---|---|
| Task Achievement / Task Response | 5.5 |
| Coherence and Cohesion | 5.5 |
| Lexical Resource | 5.5 |
| Grammatical Range and Accuracy | 5.0 |
| Overall | 5.5 |
Task Achievement / Task Response: Band 5.5
You identify the broad period and several important patterns, including the decline in households with dependent children and the rise in one-person and lone-parent households. However, the overview is not clearly separated from the details, and some descriptions are inaccurate or unclear. For example, “working children and old-parent only” are not categories in the table; the figures refer to non-dependent children and lone-parent households. The statement that one-person households increase “by 2%” is ambiguous: the share rises from 6% to 12%, with a two-point rise between some successive years, not a total increase of two points. You also omit the final 2007 figures for several categories. Select the main trends accurately and summarise them clearly.
Coherence and Cohesion: Band 5.5
The response has a basic sequence: an introduction, an attempted overview, and paragraphs moving from 1971 to 2007. This gives the reader some sense of organisation. However, progression is weakened by unclear grouping and abrupt transitions. The overview lists categories without explaining the main contrasts, while “In 1971, first” and “In contrast with modern time” do not create a smooth comparison. Several ideas are repeated, such as describing the no-children group as both “family with no child” and “family with zero child.” Punctuation and sentence boundaries also make relationships difficult to follow. Grouping the largest decline together with the rising categories, then comparing start and end values, would make the information easier to track.
Lexical Resource: Band 5.5
You use some relevant task vocabulary, including “dependent children,” “one-person,” “increase,” “decreases,” and “stable,” so the topic is generally recognisable. However, the range is limited and several word choices or spelling errors reduce precision: “demostrate,” “indiviual,” “higgest,” and “represnt” are noticeable, while “old-parent only” does not accurately name a table category. Phrases such as “family with zero child” and “population” are also unnatural or imprecise for describing household percentages. Use standard category labels consistently and choose precise terms such as “proportion” or “share” when discussing percentages. Proofreading spelling and collocations would make your meaning clearer.
Grammatical Range and Accuracy: Band 5.0
You attempt both simple statements and longer comparisons, including a sentence using “while” to contrast the two family types. However, the range is limited, and errors occur frequently enough to make some sentences difficult to interpret. The opening, “The table demostrate, that how family household types changes,” has an incorrect clause structure and subject–verb agreement. Other examples include “dependent children family are higgest” and the fragment “52%, children are dependent on their family.” Articles, plurals, and punctuation are also inconsistent, as in “one type, that decreases.” Practise accurate sentence patterns such as “The proportion of households with dependent children fell from 52% to 36%,” and check agreement and sentence boundaries.
See this exact question answered at other band scores. The same prompt compared across bands.
Browse more IELTS Writing model answers or get your own writing scored by the same AI examiner.