Band 6.5 IELTS Writing Task 1 Model Answer
Overall Band Score: 6.5 · IELTS Summit Mastery · 2026-11-13
IELTS Writing Task 1 question
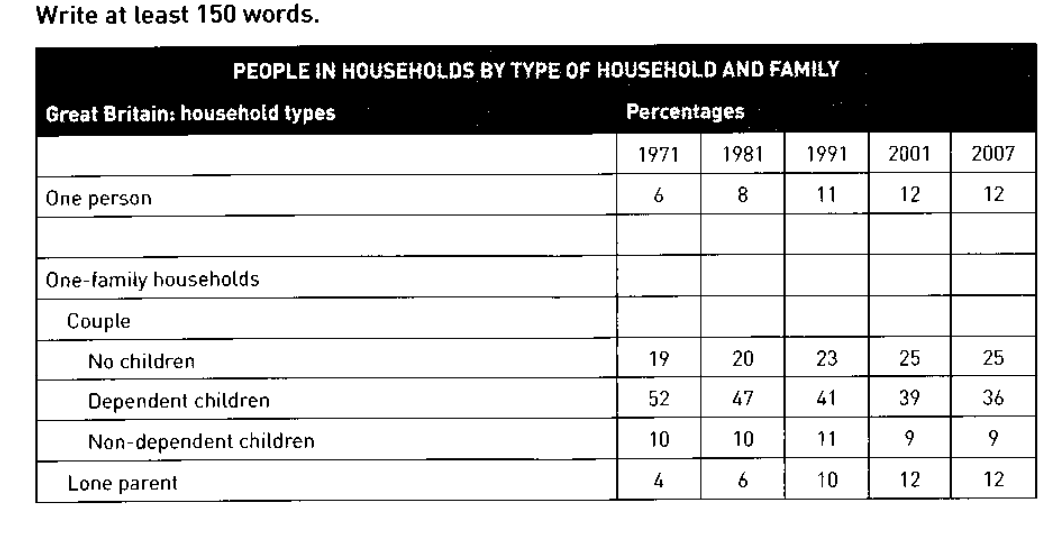
The table below shows the change in some household types in Great Britain from 1971 to 2007.
Summarise the information by selecting and reporting the main features, and make comparisons where relevant.
PEOPLE IN HOUSEHOLDS BY TYPE OF HOUSEHOLD AND FAMILY
Student answer (Band 6.5)
The table illustrates the percentages of people living in different kinds of households and families in Great Britain from 1971 to 2007.
Overall, the chart describes three different types of household; one person, one-family households and lone parent. Couples living with there dependent children accounted for highest percentages in all five years, while one person and lone parent household showed lowest proportion during the mentioned period.
In 1971, more than half of the households contained couples with dependent children, while only 19% accounted for no children, 10% for No-dependent children, 6% for one person and only 4% for lone parent. In contrast, in 2007, figure for dependent children fell down notably to 36% which is the lowest number for this category. However, proportion of one person houshold and lone parent increased significantly to 12%, both in 2001 and 2007..
In 2001, the percentage for couples with no children gradually went up and reached to its peak of fairly around a quarter of the whole housholds by 2007. Contrary to this, proption of households with non-dependent children slightly reduced from 10% to 9% at the end of the period.
AI examiner evaluation
| Criterion | Band |
|---|---|
| Task Achievement / Task Response | 6.5 |
| Coherence and Cohesion | 6.5 |
| Lexical Resource | 6.0 |
| Grammatical Range and Accuracy | 6.0 |
| Overall | 6.5 |
Task Achievement / Task Response: Band 6.5
You identify the main pattern accurately: households with dependent children were the largest category throughout, and their share declined from 52% to 36%, while one-person and lone-parent households rose. You also include relevant figures for the other categories. However, the overview is not fully precise: it calls one-person and lone-parent households the “lowest” proportions, although lone-parent households were the smallest in 1971 and one-person households were not consistently among the lowest later. The description of the no-children category is also unclear, and the 2001 figure is not reported. This covers the task and gives a useful selection of data, but some comparisons and overview points need clearer development and more exact wording.
Coherence and Cohesion: Band 6.5
The response has a clear overall structure: an introduction, an overview, and two paragraphs presenting figures and changes. The sequence from the starting year to the end of the period is generally easy to follow, and linking expressions such as “In contrast” and “However” help signal comparisons. Some connections are less effective, though. The overview groups “one person” and “lone parent” together as the lowest categories without clarifying how their positions change, and “In 2001” begins a sentence that then describes a trend through 2007, making the time reference slightly confusing. The final paragraph also shifts between categories without a fully consistent comparison pattern. More precise referencing and a clearer progression through the categories would strengthen cohesion.
Lexical Resource: Band 6.0
You use an adequate range of vocabulary for describing data, including “accounted for,” “increased significantly,” “reduced,” and “peak.” These choices help communicate the main trends, and the meaning is generally clear. However, some word choices and collocations are inaccurate or awkward, such as “the chart describes,” “fell down notably,” “reached to its peak,” and “fairly around a quarter.” There are also spelling errors in “houshold,” “housholds,” and “proption,” as well as inconsistent capitalisation in “No-dependent.” Use standard data-reporting phrases such as “the table shows,” “fell markedly,” and “reached a peak of approximately a quarter.” Greater accuracy in collocation and spelling would make the vocabulary more controlled and precise.
Grammatical Range and Accuracy: Band 6.0
You use a mix of simple and complex sentence forms, including contrast clauses beginning “while” and “although” and sentences linked with “which.” Most of the information remains understandable, but some grammatical errors recur. For example, “Couples living with there dependent children accounted for highest percentages” needs a possessive form and an article (“their” and “the highest percentage”), while “the percentage … went up and reached to its peak” has an incorrect verb pattern. “In 2007, figure” also needs an article, and the sentence ending “both in 2001 and 2007” is attached awkwardly to the preceding claim. Punctuation is occasionally faulty, including the doubled full stop after “2007.” More accurate articles, verb patterns, and sentence boundaries would improve control.
See this exact question answered at other band scores. The same prompt compared across bands.
Browse more IELTS Writing model answers or get your own writing scored by the same AI examiner.