Band 6.0 IELTS Writing Task 1 Model Answer
Overall Band Score: 6.0 · IELTS Summit Mastery · 2026-11-13
IELTS Writing Task 1 question
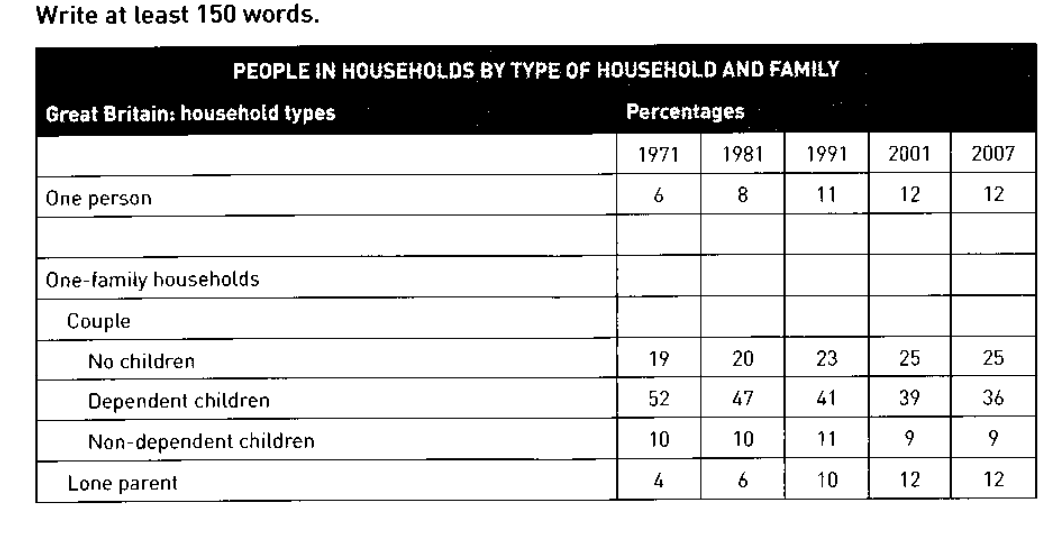
The table below shows the change in some household types in Great Britain from 1971 to 2007.
Summarise the information by selecting and reporting the main features, and make comparisons where relevant.
PEOPLE IN HOUSEHOLDS BY TYPE OF HOUSEHOLD AND FAMILY
Student answer (Band 6.0)
The given chart illustrates the percentage of different types of household families.It also shows the proportion rate from 1971 to 2007.
In 1971, couples with dependent children had the highest percentage that was 52 percent.Couples with no children have second highest ratio whish is 19 percent in 1971.Over the years the percentage of both categories had decreased until 2007. On the other hand, percentage of one person household system was increased from 6 to 12 percent over the years.
Similarly, ration of lone parent household system was also increased from 4 to 12 percent. Only the household system , the couple with non dependent children showed fluctuation.In 1971, it was 10 percent. Its level became high from 10 to 11 percent in 1991 but it falle down again in coming years and reached to 9 percent.
So, in short we can say that the percentage rate of the household families with dependent children and no children decreased while the percentage of one person and lone parent household increased over the years.
AI examiner evaluation
| Criterion | Band |
|---|---|
| Task Achievement / Task Response | 6.5 |
| Coherence and Cohesion | 6.5 |
| Lexical Resource | 5.5 |
| Grammatical Range and Accuracy | 5.5 |
| Overall | 6.0 |
Task Achievement / Task Response: Band 6.5
You identify the main pattern accurately: households with dependent children fell from 52% to 36%, while one-person and lone-parent households rose from 6% and 4% to 12%. You also note the small rise and later fall in non-dependent-child households. This gives a relevant overview and covers the main categories. However, some comparisons are not fully precise: the no-children category increased from 19% to 25%, rather than decreasing, so the final summary incorrectly groups it with the declining category. The opening also calls the visual a chart, though it is a table. To strengthen the response, check each trend against the figures and include the final values when describing changes, especially for the categories that do not follow the overall decline.
Coherence and Cohesion: Band 6.5
The response has a generally understandable sequence: it introduces the table, describes the leading categories, then covers the rising household types and the fluctuating category before concluding. Connectors such as “On the other hand,” “Similarly,” and “So, in short” help signal relationships between ideas. This provides a coherent overall arrangement. However, the paragraphing is limited, and some links are mechanical or unclear; for example, “Only the household system, the couple with non dependent children showed fluctuation” is difficult to follow. The conclusion repeats the overview but includes the inaccurate claim that no-children households decreased. Grouping the information into a clear overview and two body paragraphs, and using more precise references to categories, would make progression smoother.
Lexical Resource: Band 5.5
You use relevant topic vocabulary, including “dependent children,” “lone parent,” “percentage,” and “fluctuation,” so the reader can generally understand which household types you mean. There is also some attempt to vary wording with “proportion” and “ratio.” However, several choices are unnatural or inaccurate for describing table data: “percentage rate,” “household system,” and “ratio” are not suitable here, and “chart” does not accurately name the table. Spelling errors such as “whish,” “ration,” and “falle” are noticeable. Aim for consistent, precise terms such as “share,” “proportion,” and “household category,” and check spelling and collocations before submitting.
Grammatical Range and Accuracy: Band 5.5
You attempt both simple and more complex sentence forms, including “Over the years the percentage of both categories had decreased until 2007” and the sentence describing the rise and fall in non-dependent-child households. The main meaning is usually recoverable, but errors in verb forms, agreement, articles, and punctuation are evident. For example, “Couples with no children have second highest ratio” needs a past-tense verb and an article, while “percentage … was increased” uses an incorrect passive form. The opening also runs two sentences together after “families.” Use past simple consistently for the historical figures (“rose,” “fell,” “stood at”), and check sentence boundaries and article use. More accurate control of these patterns would make your varied sentences clearer.
See this exact question answered at other band scores. The same prompt compared across bands.
Browse more IELTS Writing model answers or get your own writing scored by the same AI examiner.