Band 5.5 IELTS Writing Task 1 Model Answer
Overall Band Score: 5.5 · IELTS Summit Mastery · 2026-11-13
IELTS Writing Task 1 question
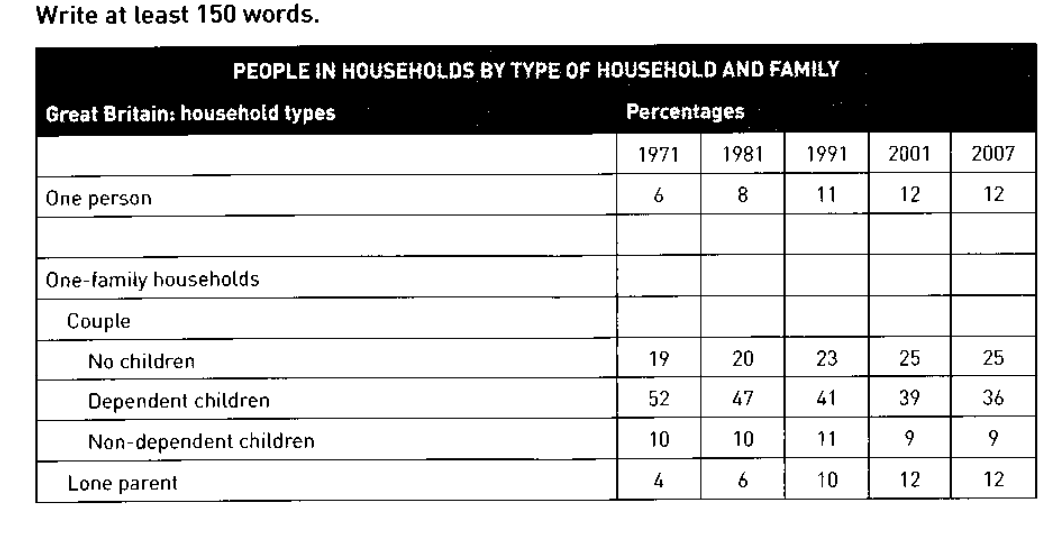
The table below shows the change in some household types in Great Britain from 1971 to 2007.
Summarise the information by selecting and reporting the main features, and make comparisons where relevant.
PEOPLE IN HOUSEHOLDS BY TYPE OF HOUSEHOLD AND FAMILY
Student answer (Band 5.5)
The table illustrated some household change in britain from 1971 to 2007 .
Overall table show the types of household and its percentage the highest percentage was of dependent childern just in 1971 while other were in normal range such as Non- dependent ,Loneparent ,No childern . Some household were empty although zero percent .
One person household in 1971 were at 6 percent but slowly rised in 2007 it reached to 12 percent .One -family households and couple household were having zero percentage from 1971 to 2007.No childern household in Britan was 19 percent in 1971 but later on it smoothly get high and reach to 25 percent in 2007 .
Dependent childern household were among the all of other houshold due to its 52 percentage however just in 1971 later on it slightly reduce in 2007 about to 36 percent .while non-dependent was moderat but slightly get on percent high in 1991 than again droped . Lone parent household were not common in 1971 but late in 2007 they reached to 12 percent.
In conclusion,the most among was Dependent childern household in 1971 and also in 2007 whie on the other hand the lowest one in 1971 was lone parent household.
AI examiner evaluation
| Criterion | Band |
|---|---|
| Task Achievement / Task Response | 5.5 |
| Coherence and Cohesion | 5.5 |
| Lexical Resource | 5.0 |
| Grammatical Range and Accuracy | 5.0 |
| Overall | 5.5 |
Task Achievement / Task Response: Band 5.5
You identify several relevant trends, including the rise in one-person households from 6% to 12%, the increase in couples without children from 19% to 25%, and the decline in households with dependent children from 52% to 36%. However, the overview is unclear and includes a major misreading: you say that one-family and couple households had zero percentages, although the table gives figures for the one-family subcategories. The conclusion also incorrectly calls dependent-children households the largest in 2007; at 36%, they are still the largest category, but this should be stated with accurate comparison and context. Some trends, such as non-dependent children, are described vaguely. Select the main patterns and report them precisely, avoiding unsupported claims such as households being “empty.”
Coherence and Cohesion: Band 5.5
The response has an opening, an overview, and further paragraphs describing individual categories, so there is some organisation. The figures are generally presented in chronological order, which helps the reader follow changes. However, progression is weakened by unclear links and repeated or contradictory statements. For example, the overview says some households were “empty although zero percent,” and the later claim that couple households had zero percentages conflicts with the figures that follow. Connect related trends in a clearer order—for instance, group the rising categories together and contrast them with the decline in dependent-child households. Use linking words selectively and make references such as “other” or “they” explicit so the reader can easily identify each household type.
Lexical Resource: Band 5.0
You use some task-relevant vocabulary, including “percentage,” “dependent,” “non-dependent,” “lone parent,” and “reached,” which helps communicate the subject. However, the range is limited and several word choices or collocations are inaccurate or unclear, such as “normal range,” “smoothly get high,” and “among the all of other household.” Repetition of “household” and “percent” also makes the description less precise. Spelling errors—including “childern,” “Britan,” and “droped”—are noticeable and can distract the reader. Build a more accurate set of trend expressions, such as “rose steadily,” “declined,” and “remained stable,” and use precise category labels consistently. Proofreading spelling and choosing natural collocations would make the data easier to understand.
Grammatical Range and Accuracy: Band 5.0
The response attempts both simple and more extended sentences, including contrasts introduced by “while” and “but.” However, control is inconsistent, and errors in sentence structure, verb forms, agreement, articles, and punctuation sometimes make the meaning difficult to follow. For example, “Overall table show” lacks an article and subject–verb agreement, while “One person household in 1971 were at 6 percent” has faulty agreement and phrasing. The sentence beginning “Dependent childern household were among the all…” is also difficult to parse, and several sentences run together without appropriate punctuation. Practise writing complete, clearly punctuated sentences with accurate past-tense reporting, such as “The proportion rose from 6% in 1971 to 12% in 2007.”
See this exact question answered at other band scores. The same prompt compared across bands.
Browse more IELTS Writing model answers or get your own writing scored by the same AI examiner.