Band 5.5 IELTS Writing Task 1 Model Answer
Overall Band Score: 5.5 · IELTS Summit Mastery · 2026-11-14
IELTS Writing Task 1 question
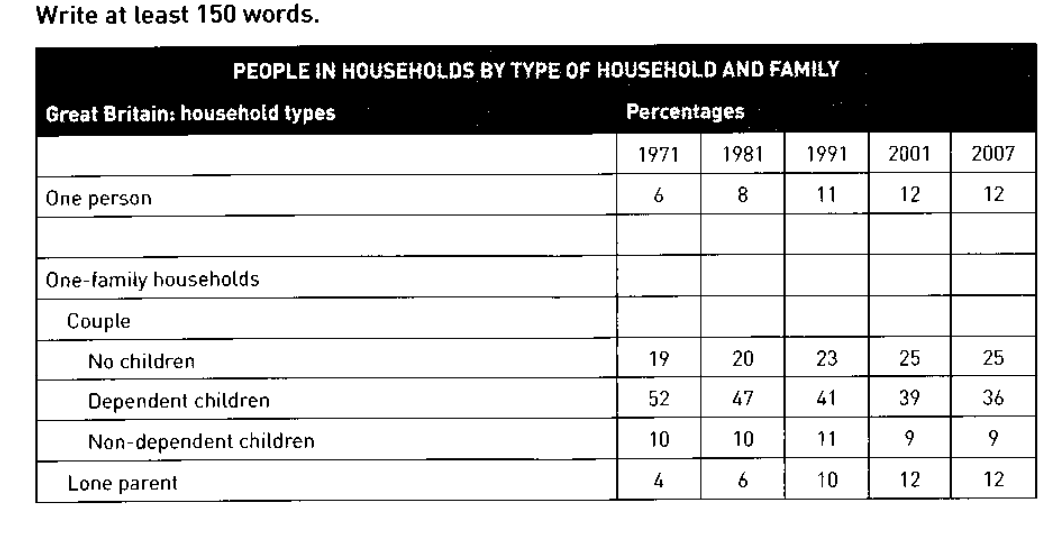
The table below shows the change in some household types in Great Britain from 1971 to 2007.
Summarise the information by selecting and reporting the main features, and make comparisons where relevant.
PEOPLE IN HOUSEHOLDS BY TYPE OF HOUSEHOLD AND FAMILY
Student answer (Band 5.5)
The percentage of a person living alone in Great Britain follows in an increase from the years 1971 to 1991 and then reaches a fixed rate from 2001 to 2007. Considering the percentage of couples not having any children being the lowest in 1971, the number of dependant children in 1971 were inevitably going to have an increase from the other years. There is a gradual increase in not having children as the years increase but eventually reach a state of no change during the 2000s as shown in the table that the percentage is 25% in 2001 and 2007. Furthermore the independent children in 2000s also have the same percentage. With this, the number of dependant children show a regular pattern of it decreasing. In addition to this the percentage of lone parents increase with the timeline increasing from 1971 to 2007.
AI examiner evaluation
| Criterion | Band |
|---|---|
| Task Achievement / Task Response | 5.0 |
| Coherence and Cohesion | 5.0 |
| Lexical Resource | 5.5 |
| Grammatical Range and Accuracy | 5.5 |
| Overall | 5.5 |
Task Achievement / Task Response: Band 5.0
You identify several relevant trends, including the rise in one-person households and lone-parent households, and the fall in households with dependent children. However, the response only partially summarises the table: it gives no clear overall overview and omits important comparisons, especially that dependent-child households remained the largest category despite declining. Some statements are unclear or inaccurate: “the number of dependant children in 1971 were inevitably going to have an increase” does not match the data, which show a decrease from 52% to 36%, and “independent children” is not the table’s category. The response also contains 143 words, below the required 150. To improve, state the main overall patterns clearly and support them with accurate figures across the period.
Coherence and Cohesion: Band 5.0
The response follows a broadly chronological approach and uses linking expressions such as “Furthermore” and “In addition to this” to connect observations. However, it is presented as one paragraph, with no distinct overview or clear grouping of the table’s main features. The progression is also difficult to follow: the sentence about couples without children moves abruptly to dependent children, and “With this” does not clearly show how the ideas relate. Some connections are repetitive, particularly the repeated references to increases over time. Organise the response into an introduction, an overview, and one or two detail paragraphs, grouping related trends together and using precise references so the reader can follow each comparison.
Lexical Resource: Band 5.5
You use some relevant vocabulary for describing data, including “percentage,” “gradual increase,” “decreasing,” and “no change.” This gives you a basic range for reporting trends. However, several choices are inaccurate or unnatural and reduce precision: “follows in an increase” and “reaches a fixed rate” are awkward, while “independent children” mislabels the table’s “non-dependent children.” “The timeline increasing” is also an imprecise way to refer to the years. Aim for standard chart language and use the category labels exactly as given. More accurate collocations such as “rose,” “remained stable,” and “households with non-dependent children” would make the description clearer and more natural.
Grammatical Range and Accuracy: Band 5.5
You attempt a mixture of sentence forms, including longer sentences with clauses introduced by “Considering” and “as shown in the table.” However, control is uneven, and several structures are faulty or awkward. For example, “the number of dependant children in 1971 were” has a subject–verb agreement problem, and “the percentage of lone parents increase” uses the wrong verb form. The opening sentence also has an unclear construction: “follows in an increase … and then reaches a fixed rate.” Some sentences combine several ideas without clear grammatical relationships. Practise forming direct comparisons with accurate subjects and verbs, such as “The proportion rose from 6% to 11%, then remained stable.”
See this exact question answered at other band scores. The same prompt compared across bands.
Browse more IELTS Writing model answers or get your own writing scored by the same AI examiner.