Band 6.0 IELTS Writing Task 1 Model Answer
Overall Band Score: 6.0 · IELTS Summit Mastery · 2026-11-14
IELTS Writing Task 1 question
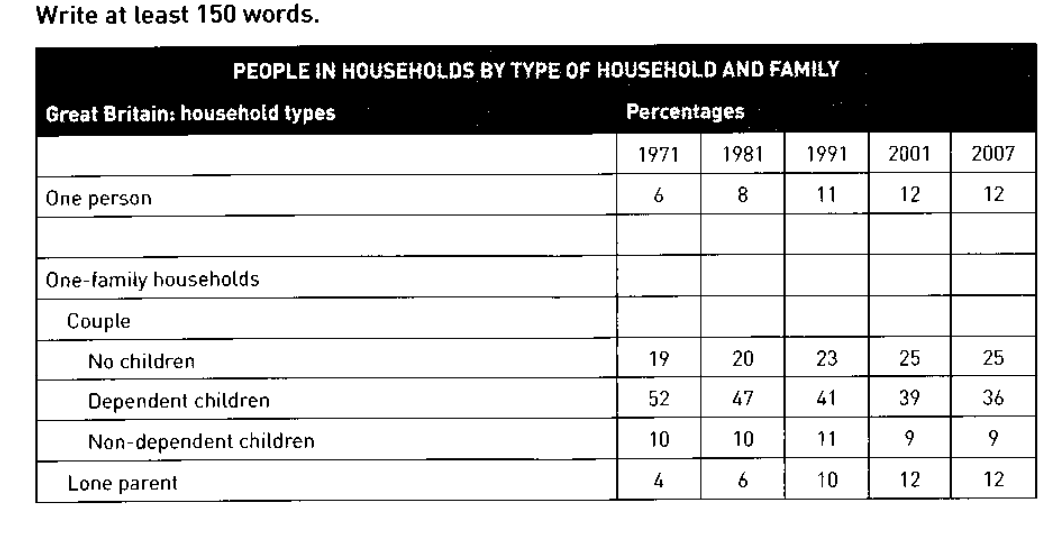
The table below shows the change in some household types in Great Britain from 1971 to 2007.
Summarise the information by selecting and reporting the main features, and make comparisons where relevant.
PEOPLE IN HOUSEHOLDS BY TYPE OF HOUSEHOLD AND FAMILY
Student answer (Band 6.0)
The table illustrates the proportion of people household in Great Britain between 1971 to 2007.
Overall, couple with dependent children were the highest household category at the beginning though their percentage declined. Couple without children, lone parents and single person's household rose throughout the time, where couple with non- dependent children percentage decreased.
In 1971, the percentage of one person household rose double and it increased 6% to 12%. Increasing trend also found in couple with no children household, the percentage rose from 19% (1971) to 25% (2007). The percentage of household became almost triple in lone parents category till 2007, in 1971 4% and in 2007 it reached 12%.
However, the percentage of the household in couple with dependent children were almost 52% in 1971 and then this percentage declined in 1981,1991,2001 and 2007, it was 47%, 41%,39% and 36% respectively. Apert form that, percentage of couple with non-dependent children households also found decreasing trend, in 1971 it was 10% and 9% in 2007.
AI examiner evaluation
| Criterion | Band |
|---|---|
| Task Achievement / Task Response | 6.5 |
| Coherence and Cohesion | 6.5 |
| Lexical Resource | 6.0 |
| Grammatical Range and Accuracy | 5.5 |
| Overall | 6.0 |
Task Achievement / Task Response: Band 6.5
You identify the main pattern accurately: households with dependent children were the largest category but declined, while one-person, childless-couple and lone-parent households increased. The figures you give for these groups are consistent with the table, and you also note the slight fall in non-dependent-child households by the end. This covers the key categories and provides a relevant overview. To make the report more complete and precise, clarify that the one-person share rose from 6% to 12%—rather than saying it “rose double”—and describe the non-dependent-child figures across the intervening years, which briefly reached 11% in 1991 before falling. Some trends are reported more fully than others, so a little more precise comparison would strengthen the response.
Coherence and Cohesion: Band 6.5
The response has a clear overall structure: an introduction, an overview, and two paragraphs grouping the rising and falling categories. This makes the main comparisons easy to follow, and transitions such as “Overall” and “However” help signal the direction of the discussion. The progression is generally logical, although some links are awkward or unclear. For example, “In 1971, the percentage of one person household rose double” combines a starting year with a trend in a confusing way, and “Apart form that” does not clearly show how the final category relates to the preceding one. Use more precise links and keep each sentence focused on one comparison; this would make cohesion less mechanical and the progression smoother.
Lexical Resource: Band 6.0
You use a relevant range of vocabulary for describing data, including “proportion,” “declined,” “increased,” and “percentage,” and the reader can understand the categories and broad trends. There are also attempts at more specific phrasing, such as “dependent children” and “lone parents.” However, several word choices and collocations are inaccurate or repetitive: “percentage of people household,” “rose double,” and “percentage of the household” do not express the intended meanings naturally. “Apert form” is also a spelling error, and repeated use of “percentage” limits flexibility. Choose standard chart language such as “share of households,” “doubled,” and “apart from that,” and vary the wording where appropriate.
Grammatical Range and Accuracy: Band 5.5
You attempt both simple and more complex sentences, including a contrast with “though” and a clause beginning “However,” so there is some structural variety. The main trends remain understandable, but grammatical errors occur in several sentence patterns. For example, “the proportion of people household” lacks a correct noun structure, while “between 1971 to 2007” uses an incorrect preposition pattern. Agreement is also inconsistent in “couple with dependent children were,” and the sentence “it increased 6% to 12%” is missing the appropriate construction for describing a change. Work on articles, singular/plural agreement, and standard comparison patterns such as “from … to …” to improve accuracy while retaining your attempts at complex sentences.
See this exact question answered at other band scores. The same prompt compared across bands.
Browse more IELTS Writing model answers or get your own writing scored by the same AI examiner.