Band 5.0 IELTS Writing Task 1 Model Answer
Overall Band Score: 5.0 · IELTS Summit Mastery · 2026-11-15
IELTS Writing Task 1 question
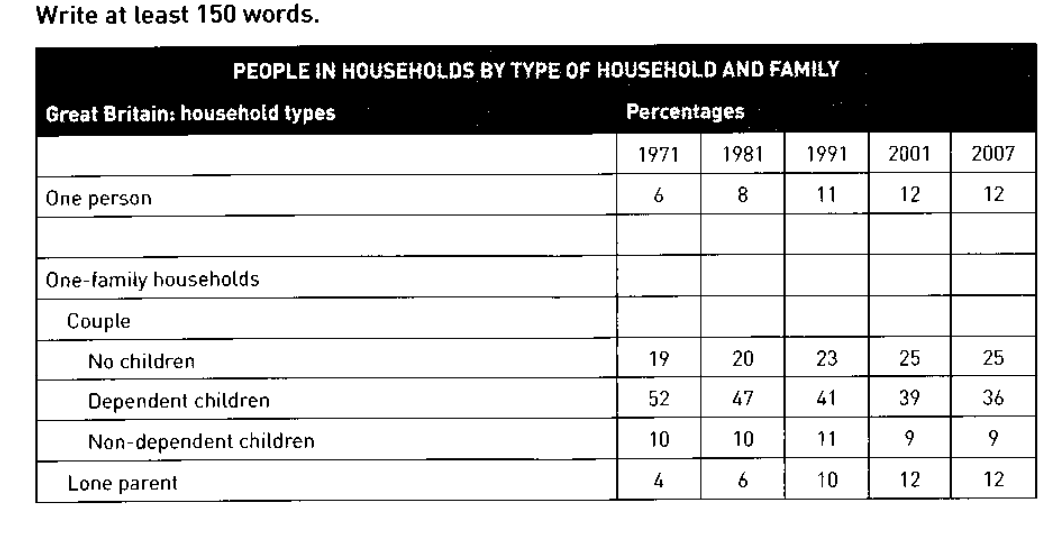
The table below shows the change in some household types in Great Britain from 1971 to 2007.
Summarise the information by selecting and reporting the main features, and make comparisons where relevant.
PEOPLE IN HOUSEHOLDS BY TYPE OF HOUSEHOLD AND FAMILY
Student answer (Band 5.0)
The table chart illustrates information about the changes in some household types in great Britain from 1971 to 2007.
By having a cursory glance, it is vivid that, the great Britain in one person household family percentage was 6 in 1971 then it rised to 12% in 2001 and 2007.Afterthat, one family household and couple doesnot any percentage. Moreover, no children have 19% in 1971 then it significantly increased to 25% till 2007.
Moving further ahead, it is lucid that, the dependent children was 52% in 1971 afterthat it decline to 36% till 2007.
AI examiner evaluation
| Criterion | Band |
|---|---|
| Task Achievement / Task Response | 4.0 |
| Coherence and Cohesion | 5.0 |
| Lexical Resource | 5.0 |
| Grammatical Range and Accuracy | 5.0 |
| Overall | 5.0 |
Task Achievement / Task Response: Band 4.0
You identify several relevant figures, including the rise in one-person households from 6% to 12% and the fall in households with dependent children from 52% to 36%. However, the response covers only part of the table: it omits the non-dependent-children and lone-parent categories, and gives no clear overall summary of the main trends. The statement that “one family household and couple doesnot any percentage” is inaccurate; the table gives figures for one-family household subtypes, not zero percentages. The response is also 83 words, below the required 150, so there is not enough development to summarise and compare the data adequately. Include a concise overview and report the main changes across the categories.
Coherence and Cohesion: Band 5.0
There is a basic attempt to organise the response, moving from one-person households and couples to the child-related categories. Phrases such as “Moreover” and “Moving further ahead” signal transitions, and the figures are generally presented in chronological order. However, the response has no distinct overview and its progression is incomplete, ending after the dependent-children figures. Some linking phrases feel mechanical or do not clarify the relationship between points, while the sentence about one-family households and couples interrupts the comparison. Use a clear overview paragraph followed by grouped comparisons, and connect each figure to the trend it illustrates.
Lexical Resource: Band 5.0
The response uses some task-related vocabulary, including “percentage,” “increased,” and “decline,” so the reader can recognise the subject and basic trends. However, the range is limited, and several word choices or collocations are unnatural or unclear: “table chart,” “By having a cursory glance,” and “it is lucid” do not express the intended ideas naturally. “One family household and couple doesnot any percentage” is especially difficult to interpret. Spelling and spacing also need attention, as in “great Britain,” “Afterthat,” and “doesnot.” Prefer straightforward, accurate reporting language such as “the table shows,” “rose,” “fell,” and “accounted for.”
Grammatical Range and Accuracy: Band 5.0
You attempt to form longer sentences using time clauses and connectors, for example, “then it rised to 12% in 2001 and 2007.” However, the response relies on a narrow range of sentence patterns, and errors occur frequently enough to make some statements difficult to follow. Examples include “it rised” instead of the correct past form, “no children have 19%” where the subject and verb pattern are unsuitable, and “the dependent children was 52%,” which has an agreement error. The sentence about one-family households is also structurally incomplete. Practise accurate past-tense reporting and simple comparison structures, such as “The figure rose from 6% to 12%” and “The proportion fell from 52% to 36%.”
See this exact question answered at other band scores. The same prompt compared across bands.
Browse more IELTS Writing model answers or get your own writing scored by the same AI examiner.