Band 5.5 IELTS Writing Task 1 Model Answer
Overall Band Score: 5.5 · IELTS Summit Mastery · 2026-11-16
IELTS Writing Task 1 question
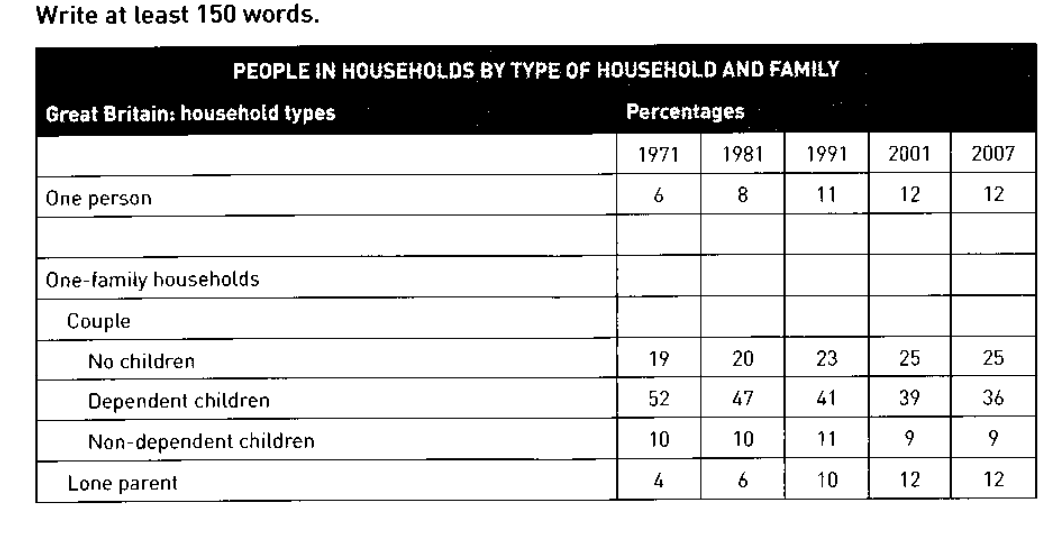
The table below shows the change in some household types in Great Britain from 1971 to 2007.
Summarise the information by selecting and reporting the main features, and make comparisons where relevant.
PEOPLE IN HOUSEHOLDS BY TYPE OF HOUSEHOLD AND FAMILY
Student answer (Band 5.5)
The table depicts the changing percentage of household types in Great Britain between 1971 and 2007.
overall it can be noted that, Dependent children were the highest percentage, however Lone parents showed the low percentage of household.
To commence with the One person that showed consistently increasing share, it was 6 percent in 1971 and reached 12% in the last year. One family household and Couple were not described any proportion. whereas, No children household Stated 19 percentage in the initial year and recorded a continuously rose and reached at the25%.
Dependent children occupied the highest percentage all the time in all the household types , it was 52% in the 1971 , but after that it was experienced the steady decreased in the percentage in it was 36% in the end of the years.similarly, Non dependent children also showed a decreasing proportion from 10 to 9.
moreover, Lone parents accounted for lowest share in all the types it was 4% in the starting and 10% in 1991 and 12% in 2007.
AI examiner evaluation
| Criterion | Band |
|---|---|
| Task Achievement / Task Response | 5.5 |
| Coherence and Cohesion | 5.5 |
| Lexical Resource | 5.5 |
| Grammatical Range and Accuracy | 5.0 |
| Overall | 5.5 |
Task Achievement / Task Response: Band 5.5
You identify the overall dominance of households with dependent children and describe several important changes, including the rise in one-person households and the fall in the dependent-children figure. However, the overview is partly inaccurate: lone-parent households were not the lowest category throughout, since non-dependent children were higher in every year, and by 2007 one-person and lone-parent households were tied at 12%. The statement that “One family household and Couple were not described any proportion” is also misleading because the table gives figures for the one-family subcategories. Some trends are reported without enough precision, such as non-dependent children, which rose to 11% in 1991 before falling to 9%. A more accurate overview and clearer comparisons across the years would strengthen the response.
Coherence and Cohesion: Band 5.5
The response has a recognisable structure: an introduction, an overview and paragraphs describing groups of figures. This gives the reader a basic route through the information. However, progression is uneven because the categories are not grouped consistently, and the sentence claiming that one-family households and couples have no figures interrupts the account rather than clarifying it. Linking words such as “To commence with,” “whereas,” “similarly” and “moreover” are used, but some connections are awkward or do not express the relationship between ideas clearly. Capitalisation and punctuation also make boundaries between points difficult to follow, as in “years.similarly”. Group related trends together and use simpler, more precise transitions to make comparisons easier to track.
Lexical Resource: Band 5.5
You use a relevant range of task vocabulary, including “percentage,” “share,” “accounted for” and “decreasing proportion,” so the main subject is generally clear. However, word choice and collocation are often inaccurate or repetitive: “showed the low percentage” and “recorded a continuously rose” do not express the trends naturally, while “occupied the highest percentage” is an awkward description of a category. Some labels are also imprecise, such as “One family household and Couple,” which does not clearly identify the table’s subcategories. Aim for accurate, conventional reporting language—for example, “accounted for,” “rose steadily” and “declined”—and use the category names consistently. This would make the limited range more effective and reduce moments where the reader has to interpret your meaning.
Grammatical Range and Accuracy: Band 5.0
You attempt both simple and longer sentence forms, and the main figures can usually be understood. However, control is inconsistent, particularly in complex clauses and sentence boundaries. For example, “No children household Stated 19 percentage … and recorded a continuously rose” combines an incomplete or awkward clause with an incorrect verb form. In “it was experienced the steady decreased in the percentage in it was 36%,” the structure and tense obscure the intended comparison. There are also errors in articles, agreement and punctuation, including “in the 1971” and the run-on transition “years.similarly”. Use shorter sentences when describing each trend, check subject–verb structure and past-tense forms, and punctuate each comparison as a complete sentence. Greater accuracy in these patterns would make the information clearer.
See this exact question answered at other band scores. The same prompt compared across bands.
Browse more IELTS Writing model answers or get your own writing scored by the same AI examiner.