Band 5.0 IELTS Writing Task 1 Model Answer
Overall Band Score: 5.0 · IELTS Summit Mastery · 2026-11-16
IELTS Writing Task 1 question
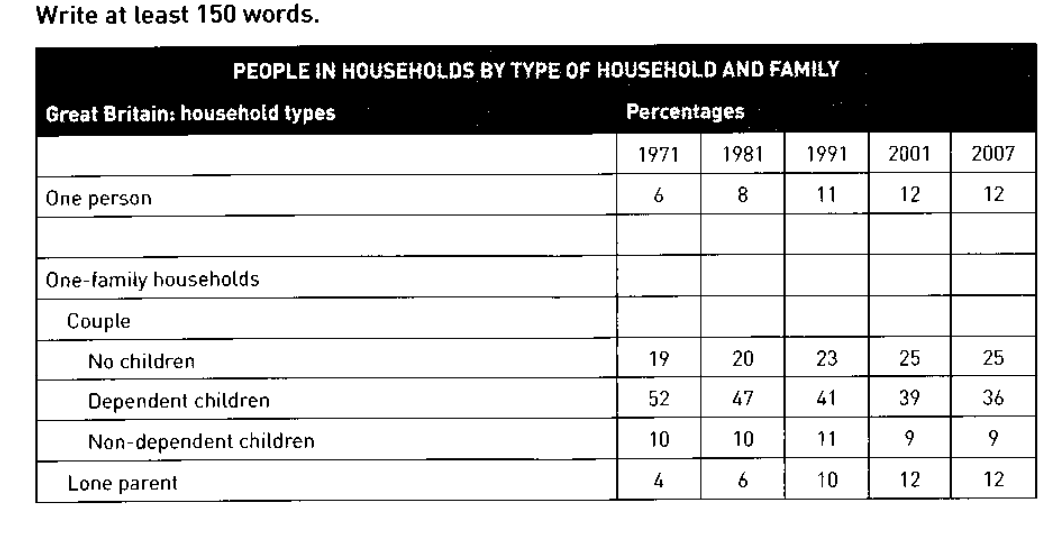
The table below shows the change in some household types in Great Britain from 1971 to 2007.
Summarise the information by selecting and reporting the main features, and make comparisons where relevant.
PEOPLE IN HOUSEHOLDS BY TYPE OF HOUSEHOLD AND FAMILY
Student answer (Band 5.0)
The chart illustrates the difference between house holds in Great Britian from 1971 to 2007.
This chart have different household categories which are One person living in a house hold, One family households branches which will be Couple, No children. Dependent children, Non dependent children and Lone Parent.This chart Also shows that which years are this data from.These years will be 1971, 1981, 1991, 2001 and 2007.
Looking at the percentage of One person living in a house hold which was 6 percent in 1971, 8 in 1981, 11 in 1991, 12 in 2001 and then remain same as 12 percent until 2007. Then we have No children category. in the chart there were 19 percent of household which had no childrens in them in 1971, then in 1981 it became 20, then from 1991 to 2001 this number increased from 23 to 25 percent and remained same until 2007. Then Dependent children which was 52 percent in 1971 and it decreased to 47 in 1981 then to 41 in 1991 to 39 in 2001 and eventualy to 36 percent of the houeholds in Great Britian had Dependent children in them in 2007. Then Non-dependent children which was 10 percent in 1971 and it remained 10 in 1981 then increased to 11 in 1991 then decreased to 9 percent in 2001 and eventualy the percentage of houeholds in Great Britian which had Non-Dependent children in them in 2007 were 9. Lastly the percentage of Lone parents living in a household in Great Britian was 4 percent in 1971, 6 in 1981, 10 in 1991, 12 in 2001 and remained 12 until 2007.
AI examiner evaluation
| Criterion | Band |
|---|---|
| Task Achievement / Task Response | 4.5 |
| Coherence and Cohesion | 5.5 |
| Lexical Resource | 5.0 |
| Grammatical Range and Accuracy | 5.0 |
| Overall | 5.0 |
Task Achievement / Task Response: Band 4.5
You report several figures accurately, including the rise in one-person households from 6% to 12%, the fall in households with dependent children from 52% to 36%, and the increase in lone-parent households from 4% to 12%. However, the response mainly lists categories and year-by-year values rather than summarising the most important features. It lacks a clear overview identifying the broad pattern—for example, that dependent-child households remained the largest category but declined, while one-person and lone-parent households increased. The opening also spends space describing the table’s categories and dates instead of interpreting the data. To strengthen the response, give a concise overview and select a few key comparisons, while retaining accurate figures to support them.
Coherence and Cohesion: Band 5.5
The response follows a generally understandable order: it introduces the table and then discusses the categories in turn. This makes the figures relatively easy to locate. However, the progression is mechanical, with repeated transitions such as “Then” and “Lastly,” and the long central paragraph contains nearly all the detailed reporting. Some sentences are overloaded with several dates and changes, which makes the information harder to follow. Use separate paragraphs for the overview and the main comparisons, and group related trends—for instance, the categories that rose versus the one that declined. More varied linking and clearer sentence boundaries would make the organisation feel more deliberate.
Lexical Resource: Band 5.0
You use relevant basic terms such as “percentage,” “increased,” “decreased,” and “remained,” so the main trends can usually be understood. However, vocabulary is repetitive and some expressions are imprecise or unsuitable for formal data reporting. “Difference between households” does not clearly describe changes in household-type percentages, while “One person living in a household” is wordier than the table’s category label. There are also spelling errors, including “Britian,” “eventualy,” and “houeholds,” and inconsistent forms such as “non-dependent” and “Non-Dependent.” Build a more precise range of trend language and use the table’s labels consistently; this will make the account clearer and more academic.
Grammatical Range and Accuracy: Band 5.0
You attempt both simple statements and longer sentences that connect changes across several years, but control is uneven. Errors occur in basic sentence forms, including “This chart have” instead of “This chart has,” and “which was 6 percent” where a complete clause such as “which stood at 6 percent” is needed. The sentence beginning “Looking at the percentage…” is a fragment, and several long sentences join multiple changes without clear punctuation. There are also problems with articles, plurals, and agreement, as in “no childrens” and “the percentage … were 9.” Practise writing complete, controlled sentences and checking subject–verb agreement and singular/plural forms before adding more complex clauses.
See this exact question answered at other band scores. The same prompt compared across bands.
Browse more IELTS Writing model answers or get your own writing scored by the same AI examiner.