Band 5.0 IELTS Writing Task 1 Model Answer
Overall Band Score: 5.0 · IELTS Summit Mastery · 2026-11-18
IELTS Writing Task 1 question
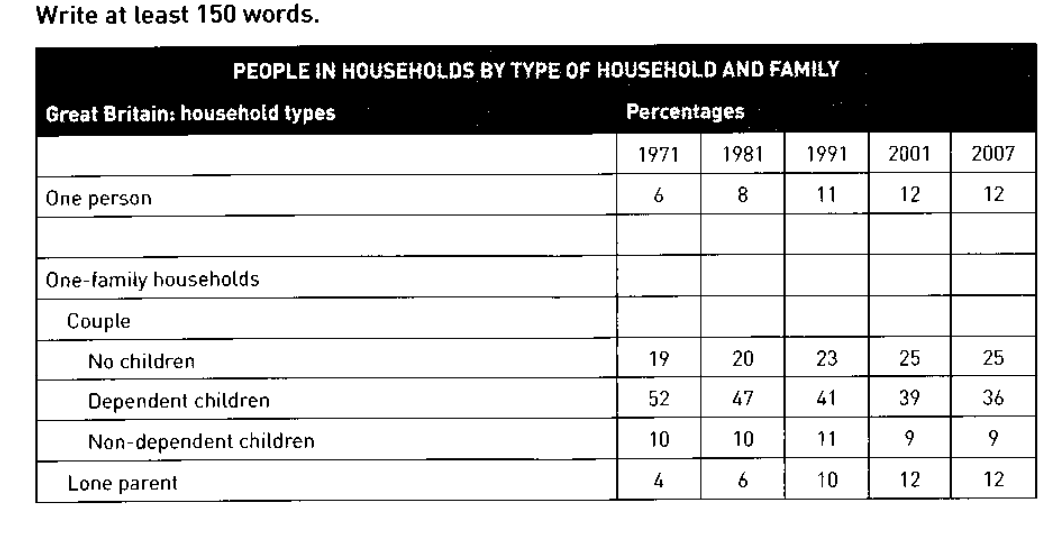
The table below shows the change in some household types in Great Britain from 1971 to 2007.
Summarise the information by selecting and reporting the main features, and make comparisons where relevant.
PEOPLE IN HOUSEHOLDS BY TYPE OF HOUSEHOLD AND FAMILY
Student answer (Band 5.0)
Here we have the data regarding the types of house hold in great britain from the year 1971 to 2007, so the type of family which is of one person only was 6% in the year 1971 which later on increased to 8% in the year 1981, followed by the increment of 3% by the year 1991 to 11%, and it again rose by 1% by the year 2001 hit the mark of 12% and stayed same till 2007 as 12% only.
Now we have the data of one-family households couple with no children which was 19% in the year 1971 which later on rose to 20% in 1981 ,23% by the year 1991 it was 25% in 2001 and 25% in 2007.
The data of family with dependent children was 52% in 1971,decreased to 47% by 1981 41% by 1991 and stayed same by 2001 and 2007 to 9% only.
Family with non dependent children were 10% in 1971 stayed same till 1981 rose to 11% in 1991 and fall by 2% and stayed at 9% in both the year 2001 and 2007.
Lone parents family were 4% in 1971 by 1981 it was 6% in the year 1991 they were 10% and trend was similiar in the year 2001 and in 2007 to 12%.
AI examiner evaluation
| Criterion | Band |
|---|---|
| Task Achievement / Task Response | 4.0 |
| Coherence and Cohesion | 5.0 |
| Lexical Resource | 5.5 |
| Grammatical Range and Accuracy | 5.0 |
| Overall | 5.0 |
Task Achievement / Task Response: Band 4.0
You report figures for all five household categories and identify several broad movements, including the rise in one-person households and the fall in households with dependent children. However, the response does not provide a clear overview of the main features, and one important figure is seriously misreported: dependent-child households fell from 52% to 36%, not to 9% in 2001 and 2007. The statement that they “stayed same” also conflicts with the table, which shows a decline from 41% in 1991 to 39% in 2001 and 36% in 2007. Other trends are mostly accurate, but the response mainly lists values rather than selecting and comparing the most significant patterns. Add a concise overview and check each figure against the table.
Coherence and Cohesion: Band 5.0
The response follows a generally understandable order, moving from one-person households through the family categories, and the repeated time references help readers follow the chronology. However, it reads as a sequence of separate data reports rather than a clearly organised summary. The repeated openings “Now we have the data” and “The data of” are mechanical, and there is no distinct overview to guide the reader toward the main comparisons. Some links between figures are also unclear, particularly in the dependent-children sentence, where the sequence of years and values is difficult to follow. Grouping the categories by rising versus falling trends, and using a separate overview followed by focused detail paragraphs, would create clearer progression.
Lexical Resource: Band 5.5
You use enough topic vocabulary to communicate the household categories and changes, including “increased,” “rose,” “decreased,” and “stayed same.” However, the range is repetitive, and several expressions are imprecise or unnatural for describing a table. For example, “increment of 3%” is less suitable than describing the figure as rising by three percentage points, while “trend was similiar” does not clearly state what happened. “House hold” and “non dependent” also show spelling or word-form control problems. Use precise reporting verbs and standard category labels, and vary your language without sacrificing accuracy. These improvements would make the data description more natural and easier to interpret.
Grammatical Range and Accuracy: Band 5.0
You attempt longer sentences that connect several years, but these are often difficult to control, and the response relies heavily on the same simple past-tense reporting pattern. In the opening sentence, the clause beginning “which later on increased” is attached awkwardly to the household description, while the long sequence of changes lacks clear sentence boundaries. There are also errors in articles, agreement, and punctuation, such as “in both the year” and the missing spaces after commas in “1971,decreased.” The dependent-children sentence is especially hard to interpret because its grammatical structure does not clearly connect the years with the figures. Use shorter, complete sentences and check agreement, articles, and punctuation.
See this exact question answered at other band scores. The same prompt compared across bands.
Browse more IELTS Writing model answers or get your own writing scored by the same AI examiner.