Band 6.0 IELTS Writing Task 1 Model Answer
Overall Band Score: 6.0 · IELTS Summit Mastery · 2026-11-18
IELTS Writing Task 1 question
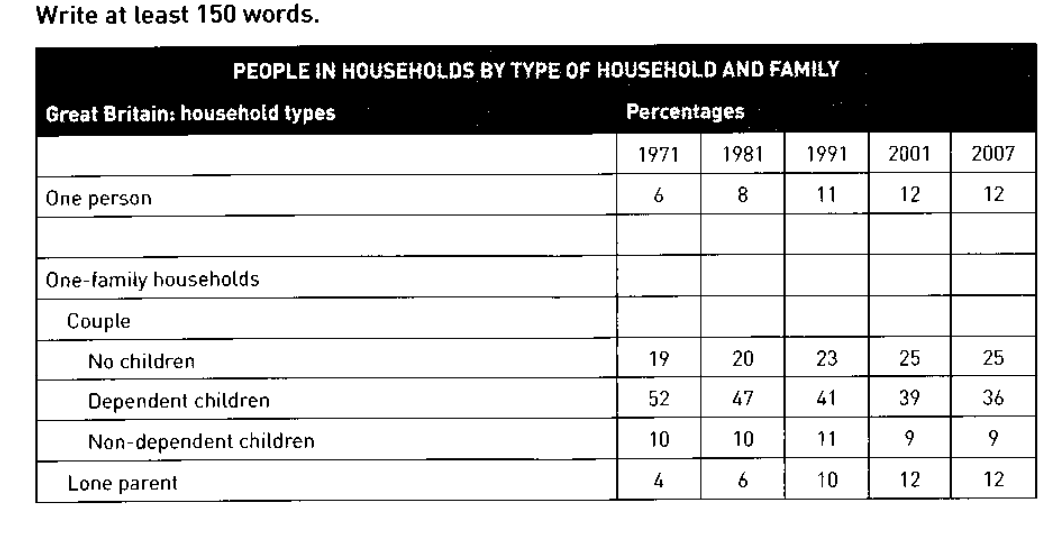
The table below shows the change in some household types in Great Britain from 1971 to 2007.
Summarise the information by selecting and reporting the main features, and make comparisons where relevant.
PEOPLE IN HOUSEHOLDS BY TYPE OF HOUSEHOLD AND FAMILY
Student answer (Band 6.0)
The table represents the proportion of one person and one family-household categories over the period between 1971 to 2007.
Overall, the percentage of one-family household remained higher compared to that of one person households. The contribution of dependent and non dependent children decreased gradually over the period, whereas that of one person, households with no children, and with a single parent increased.
In 1971, house with only one resident contributed only 6 percent to the overall proportion. In the same year, the proportion of houses with dependent children was over half of the total, accounting for 52 percent. For the same year, lone parent families contributed the least (4%). In 1981, the proportion increased for household with one person, lone parent and with no children. On the contrary, the same for the dependent children decreased by 5 percentage points, as it accounted for 47%. The percentage of non dependent children families remained the same.
In the following years, the contribution of houses with only one person increased as it acocunted for 11 and 12 percent in 1991 and 2001 respectively, and remained same as the latter for 2007. Couple households involving no children increased subsequently over the years, while that of dependent and non dependent decreased as they accounted for 36% and 9%, respectively in the final year. Compared to the proportion in 1971, the contribution of lone parent household tripled by the end of the period.
AI examiner evaluation
| Criterion | Band |
|---|---|
| Task Achievement / Task Response | 6.5 |
| Coherence and Cohesion | 6.0 |
| Lexical Resource | 6.0 |
| Grammatical Range and Accuracy | 6.0 |
| Overall | 6.0 |
Task Achievement / Task Response: Band 6.5
You identify the main pattern accurately: dependent-child households fell from 52% to 36%, while one-person, childless-couple and lone-parent households rose. The overview also correctly highlights that dependent-child households were the largest category and that lone-parent households tripled from 4% to 12%. This covers the task well and includes relevant comparisons. Some details are less fully reported, however: the figures for non-dependent children are only given at the end, and the 2007 values for the rising categories are not all stated. Also, “one-family household remained higher” is imprecise because the table separates one-family subtypes rather than giving a combined total. More precise category-level comparisons and a fuller account of the final-year figures would strengthen the response.
Coherence and Cohesion: Band 6.0
The response has a clear overall structure: an introduction, a summary of the main trends, and two paragraphs describing the figures over time. Time markers such as “In 1971,” “In 1981” and “In the following years” help the reader follow the chronology, while “On the contrary” signals a contrast. However, the organisation is mainly chronological, so related categories are sometimes separated rather than compared directly. The phrase “the same for the dependent children” is also unclear in its reference, and “For the same year” is repetitive. Grouping the rising categories together and the declining categories together, with clearer references, would make the progression more cohesive and comparisons easier to follow.
Lexical Resource: Band 6.0
You use an adequate range of task-related vocabulary, including “proportion,” “accounting for,” “decreased gradually,” “dependent children” and “lone parent.” These choices generally communicate the data clearly, and there are attempts to vary how percentages are described. Some word choices and collocations are less natural, however: “contribution” is repeatedly used for a percentage share, and “houses with only one resident” is less precise than a household term. “The same for” is also vague, while “acocunted” is a spelling error. Aim for more precise and consistent data-reporting language, such as “the share of households,” “accounted for” and “the figure for,” and check spelling carefully.
Grammatical Range and Accuracy: Band 6.0
You use a mix of simple and complex sentence forms, including a contrast clause with “whereas” and a comparison introduced by “Compared to.” Most sentences remain understandable, but some grammatical errors and awkward constructions persist. For example, “over the period between 1971 to 2007” uses an incorrect preposition pattern; write “from 1971 to 2007” or “between 1971 and 2007.” In “the percentage of one-family household remained,” the singular/plural form is inconsistent, and “remained same” is missing an article. The sentence beginning “In 1981, the proportion increased for household…” also needs clearer grammatical framing. Review articles, agreement and preposition patterns to improve accuracy while retaining your sentence variety.
See this exact question answered at other band scores. The same prompt compared across bands.
Browse more IELTS Writing model answers or get your own writing scored by the same AI examiner.