Band 5.5 IELTS Writing Task 1 Model Answer
Overall Band Score: 5.5 · IELTS Summit Mastery · 2026-11-19
IELTS Writing Task 1 question
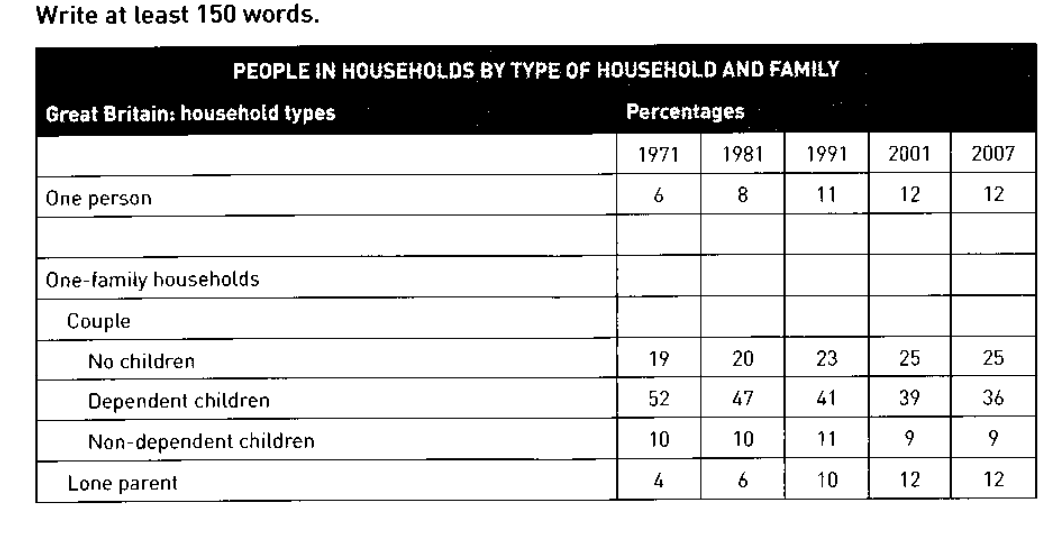
The table below shows the change in some household types in Great Britain from 1971 to 2007.
Summarise the information by selecting and reporting the main features, and make comparisons where relevant.
PEOPLE IN HOUSEHOLDS BY TYPE OF HOUSEHOLD AND FAMILY
Student answer (Band 5.5)
The table illustrates some household types in Great Britain changed between 1971 and 2007.
Overall, the percentages of one person and families that are lone parent and no children household are significantly increased, while families with dependent children have a little decrease from 1971 to 2007. some of family types are without percantage such as one family household and couple.
One person type has rose from 6% in 1971 to 12 in 2001 and remains the same in 2007. Also families with no children have a slightly increase, in 1971 the percent is 19 and improved to 20% in 1981. In addition, more increase to 23% in 1991 and 25% in 2001 and 2007.
One family households and Couples did not have a percentages. Dependant children has smooth decrease from 52% in 1971 to 36 in 2007. while Non-dependant children has a small decline from 10% in 1971 and 1981 to 9% in 2001 and 2007.
AI examiner evaluation
| Criterion | Band |
|---|---|
| Task Achievement / Task Response | 5.5 |
| Coherence and Cohesion | 5.5 |
| Lexical Resource | 5.0 |
| Grammatical Range and Accuracy | 5.0 |
| Overall | 5.5 |
Task Achievement / Task Response: Band 5.5
You identify several relevant trends, including the rise in one-person households and couples without children, and the fall in households with dependent children. The figures you give for these categories are broadly accurate. However, the overview is unclear and does not fully distinguish the main patterns: dependent-child households remained the largest category despite declining, while one-person and lone-parent households rose. The statement that some types have no percentages is inaccurate; the table gives no separate figures for the headings “one-family households” and “couple,” but it does provide figures for the subcategories. You also omit the lone-parent figures after mentioning this group in the overview. A clearer overview and fuller reporting of the key categories would make the response more complete.
Coherence and Cohesion: Band 5.5
The response has a basic structure, with an introduction, an overview and two detail paragraphs, and the information is generally grouped by household type. However, progression is weakened by the repeated and confusing claim that “One family households and Couples did not have a percentages,” which interrupts the account of the data. Some linking is mechanical, as in “Also,” “In addition,” and “while,” and the final paragraph combines unrelated points without a clear comparison. The overview also contains an unclear sentence that makes it difficult to see how the main trends relate. Organise the details into clearer groups—for example, rising categories and declining categories—and use references and transitions that show those relationships.
Lexical Resource: Band 5.0
You use some relevant task vocabulary, including “percentages,” “decrease,” “decline,” and “remains the same,” so the reader can identify the general subject and trends. However, the range is limited and several word choices or collocations are inaccurate, such as “has rose,” “a slightly increase,” “improved to 20%,” and “smooth decrease.” “Improved” suggests a positive evaluation rather than a numerical rise, while “smooth” is not a natural description of this trend. Spelling and word-form errors, including “Dependant” and “Non-dependant,” also reduce accuracy. Build a more precise set of trend expressions and check whether each verb or adjective naturally describes a percentage change.
Grammatical Range and Accuracy: Band 5.0
You attempt both simple and longer sentences, and the basic meaning of most data statements can be followed. However, grammatical errors are frequent enough to make some sentences awkward or unclear. Examples include “The table illustrates some household types … changed,” where a clause or noun phrase is needed, and “One person type has rose,” which has an incorrect verb form. Articles and agreement are also problematic in “the percent is 19” and “families … household,” while sentence boundaries and capitalisation are inconsistent, as in “while Non-dependant children.” Use a reliable pattern such as “The proportion of one-person households rose from 6% to 12%,” and check verb forms, singular/plural agreement, articles and punctuation when editing.
See this exact question answered at other band scores. The same prompt compared across bands.
Browse more IELTS Writing model answers or get your own writing scored by the same AI examiner.