Band 5.5 IELTS Writing Task 1 Model Answer
Overall Band Score: 5.5 · IELTS Summit Mastery · 2026-11-19
IELTS Writing Task 1 question
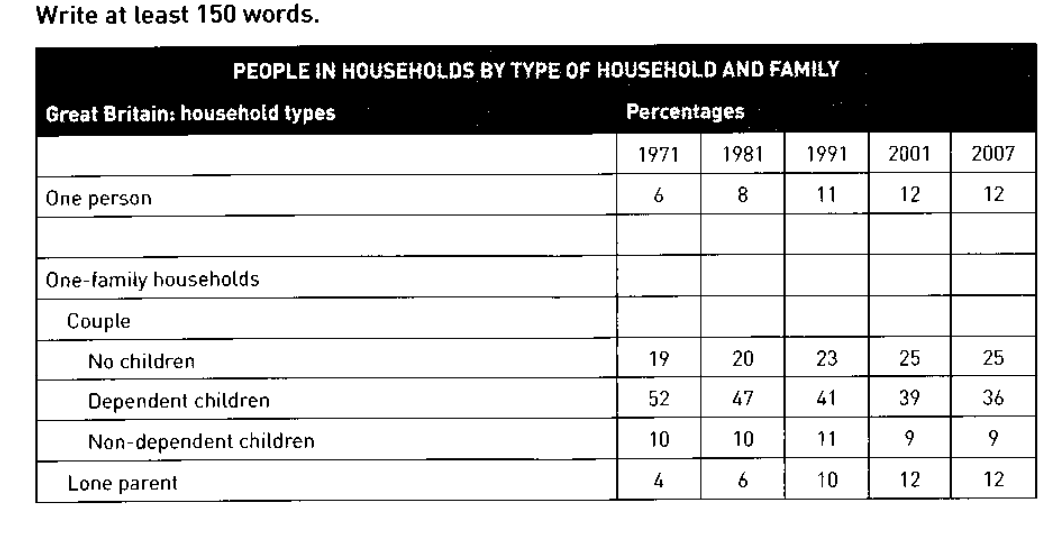
The table below shows the change in some household types in Great Britain from 1971 to 2007.
Summarise the information by selecting and reporting the main features, and make comparisons where relevant.
PEOPLE IN HOUSEHOLDS BY TYPE OF HOUSEHOLD AND FAMILY
Student answer (Band 5.5)
The table illustrate the distruibtion of house hold type in Great Britain.
overall, There was a increase in household for single person through out the decades from 1970 till 2007. For Couple with no children and Lone parent the was steady increase. For Dependent children and Non-dependent children the table show a decilne.
The One person household type had a steady increase at first form 1971 to 1991 the percentage increase from 6 to 11. From 2001 to 2007 it remains consistent.
For Couple with no children it increases from 1971 to 1991 going uptill 23 from 19 , after that it was levelled out.
Couple with Dependent children exhibit a decline through out the period , being the highest at the start in 1971 (52) and eventually it reached 36 by 2007. Non-dependent children had grown up at start reaching 11 percent by the end of 1991. It followed a decline in after that and reached 9 by the end of 2007. Lone parent showed a incline till 1991 and then it becomes constant.
AI examiner evaluation
| Criterion | Band |
|---|---|
| Task Achievement / Task Response | 6.0 |
| Coherence and Cohesion | 6.0 |
| Lexical Resource | 5.5 |
| Grammatical Range and Accuracy | 5.0 |
| Overall | 5.5 |
Task Achievement / Task Response: Band 6.0
You identify the main overall patterns: the share of one-person households, couples without children and lone-parent households generally rose, while households with dependent children declined. You also support these points with relevant figures, including the fall from 52% to 36% and the rise from 6% to 11% by 1991. This gives the response a clear overview and addresses the table. Some details are less fully reported, however: the lone-parent figure is said to become constant after 1991, but the table shows it rises from 10% to 12% by 2001 before levelling off. The non-dependent category is described as growing “by the end of 1991,” although it peaks at 11% in 1991 and then falls. More precise comparisons would strengthen the account.
Coherence and Cohesion: Band 6.0
The response has a recognisable structure: an introduction, an overview, and then details about the household categories. This makes the main trends reasonably easy to follow, and phrases such as “after that” and “throughout the period” help signal sequence. However, the overview and detail paragraphs repeat some information, and the final sentence groups the lone-parent trend without clearly distinguishing its rise to 2001 from its later stability. Some linking is mechanical, particularly the repeated use of “after that” and “and then.” Organising the details into two clearer groups—for example, rising categories and declining categories—and using more precise references to the years would make progression smoother and reduce repetition.
Lexical Resource: Band 5.5
You use relevant vocabulary for describing data, including “increase,” “decline,” “percentage,” “steady” and “consistent,” so the main trends are generally understandable. There are also attempts at more specific phrasing, such as “levelled out.” However, spelling and word-choice errors are noticeable, including “distruibtion,” “decilne” and “incline,” and some expressions are not natural in this context: “had grown up” does not describe a percentage trend, while “the highest at the start” could be expressed more precisely. Repeated reliance on “increase” and “decline” also limits flexibility. Check spelling carefully and build a small range of accurate trend phrases, such as “rose gradually,” “reached a peak” and “remained stable.”
Grammatical Range and Accuracy: Band 5.0
You attempt both simple sentences and longer structures, including “For Couple with no children it increases from 1971 to 1991 …, after that it was levelled out.” This shows some range, and the intended meaning is usually recoverable. However, errors in sentence construction and verb forms occur across the response. For example, “The table illustrate” has subject–verb disagreement, and “the percentage increase from 6 to 11” needs a finite verb such as “increased.” Tense use also shifts between past and present when describing the historical data. Articles and sentence boundaries need attention, as in “There was a increase” and the comma splice in the couple-without-children sentence. Practise accurate past-tense reporting and check each sentence for a complete, correctly linked clause.
See this exact question answered at other band scores. The same prompt compared across bands.
Browse more IELTS Writing model answers or get your own writing scored by the same AI examiner.