Band 5.0 IELTS Writing Task 1 Model Answer
Overall Band Score: 5.0 · IELTS Summit Mastery · 2026-11-19
IELTS Writing Task 1 question
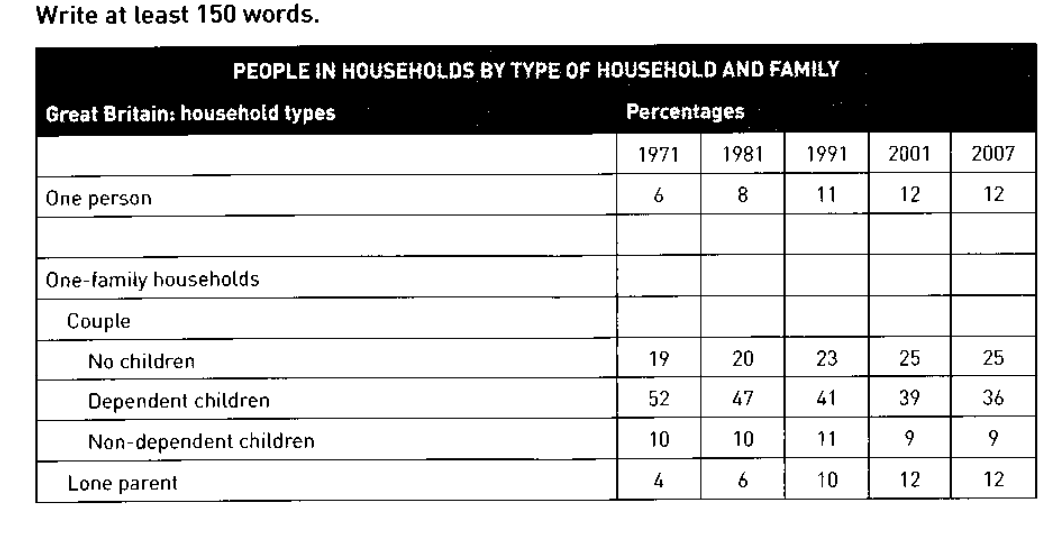
The table below shows the change in some household types in Great Britain from 1971 to 2007.
Summarise the information by selecting and reporting the main features, and make comparisons where relevant.
PEOPLE IN HOUSEHOLDS BY TYPE OF HOUSEHOLD AND FAMILY
Student answer (Band 5.0)
The table illustrates the change in some types of household and people in in the country of Great Britain from 1971 to 2007.
Overall,this tables shows the difference between the people in households by type of household and family in the year 1971 to 2007.The GreatBritain household types has the tital number of seven people making use of it and their percentages which increases in 2007.
To begin with,one person gets 6% from 1971 and it increases gradually.However,one family households and couple has no percentage shown.It became domant at that particular point of time.
On the order hand,no children has the highest trend with 19 percentage to 20 approximately 1 percent and it increases with 2 percentage each .
Lastly,the percentage of the dependent children decreased from 52% to 47 %,it continues to depreciate from 6% to 2007 . Additionaly, non-dependent children became stable in 1971 to 1981,but increased slightly to 11% and later fluctuates in the year [redacted phone].However, lone parent became the least people in the house in 1971 but it increased significantly from 6 to 10 but it remained stable from 2001 -2007.
AI examiner evaluation
| Criterion | Band |
|---|---|
| Task Achievement / Task Response | 4.5 |
| Coherence and Cohesion | 5.5 |
| Lexical Resource | 5.0 |
| Grammatical Range and Accuracy | 5.0 |
| Overall | 5.0 |
Task Achievement / Task Response: Band 4.5
You identify the period and several relevant categories, including one-person households, couples without children, dependent children and lone parents. However, the response only partially reports the table’s main features, and some statements misread or obscure the data. For example, “the GreatBritain household types has the tital number of seven people” is unsupported: the table gives percentages, not a total number of people or seven household types. The claim that no-children households rise “with 2 percentage each” is inaccurate; they increase from 19% to 25%, then remain at 25%. The dependent-children figure falls to 36%, not “from 6%.” Give a clear overview of the largest decline and the categories that rise, and report key figures accurately.
Coherence and Cohesion: Band 5.5
The response has a basic paragraph structure, moving from an introduction and overview to details, and signposts such as “To begin with” and “Lastly” help show that you are listing categories. However, the progression is not consistently clear: the overview introduces an unclear claim about “seven people,” and the discussion of “no children” is separated from the other trends without a clear comparison. Some linking expressions are inaccurate or awkward, including “On the order hand,” while repeated “However” and “Additionally” do not always clarify the relationship between ideas. Group the rising categories together and contrast them with the declining dependent-children category. Use paragraphing and linking words to show those comparisons rather than simply moving from one row to another.
Lexical Resource: Band 5.0
You use some relevant table vocabulary, such as “percentage,” “increased,” “decreased,” “stable” and “fluctuates,” so the reader can recognise the general subject. However, the range is limited and several word choices or spelling errors make parts difficult to understand. “The highest trend” is not a natural way to describe a percentage, and “became the least people in the house” does not accurately express the smallest share. “Depreciate” is also unsuitable for a falling figure; use “decline” or “fall.” There are spelling errors such as “domant,” “tital” and “Additionaly,” and “GreatBritain” should be written as two words. Choose precise terms such as “accounted for,” “rose to” and “remained unchanged” when describing the figures.
Grammatical Range and Accuracy: Band 5.0
You attempt both simple and longer sentences, including clauses joined with “but,” “however” and “which,” and the main topic is usually recognisable. Nevertheless, errors in sentence structure, agreement, articles and punctuation are frequent enough to make some statements hard to follow. For example, “Overall,this tables shows” has incorrect agreement and missing spacing after punctuation, while “The GreatBritain household types has” also has a subject–verb agreement problem. The sentence “It continues to depreciate from 6% to 2007” lacks a clear grammatical and factual relationship between the figures. Practise forming complete sentences with a clear subject and verb, and check singular/plural agreement, articles and punctuation. Shorter, accurate comparisons would be more effective than the current faulty longer constructions.
See this exact question answered at other band scores. The same prompt compared across bands.
Browse more IELTS Writing model answers or get your own writing scored by the same AI examiner.