Band 4.0 IELTS Writing Task 1 Model Answer
Overall Band Score: 4.0 · IELTS Summit Mastery · 2026-11-19
IELTS Writing Task 1 question
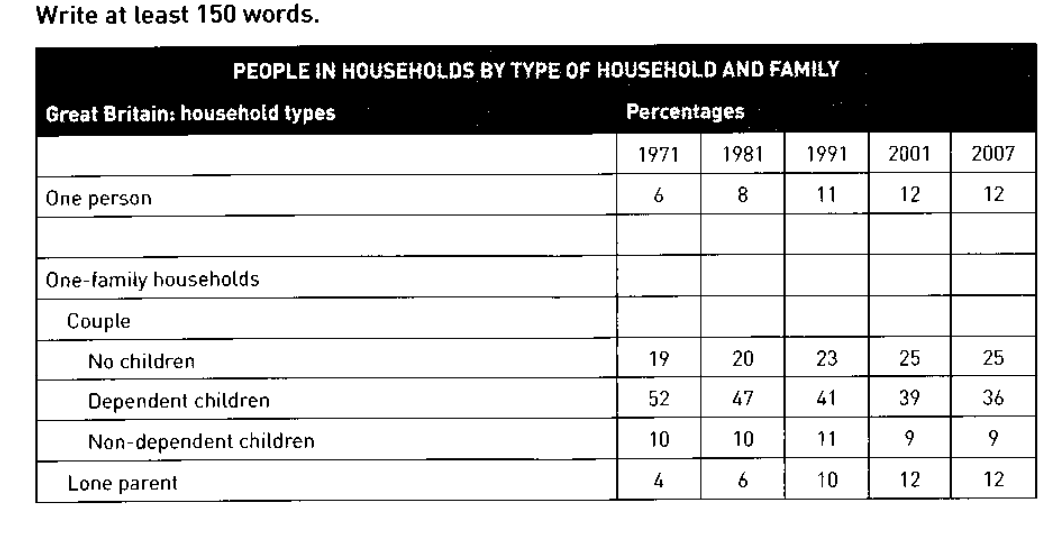
The table below shows the change in some household types in Great Britain from 1971 to 2007.
Summarise the information by selecting and reporting the main features, and make comparisons where relevant.
PEOPLE IN HOUSEHOLDS BY TYPE OF HOUSEHOLD AND FAMILY
Student answer (Band 4.0)
The table below given shows the some information like a some change household and the different types in great britain from 1971 to 2007.
there are many types of the households and the family.
The chart given shows the different people and households percentages and the great britain house hold types or many years available in this chart
One person show the 1971 six person,1981 eight person,1991 eleven person or 2001 twelve person and the 2007 twelve person.
No children 1971 19 person,1981 20 person,1991 23 person and the 2001 25 person.
Other great britain household lone parent 1971 to 2007 each available person 4 to 12.Dependant children fall the high ratio 1971 52 person,1981 47 person ,1991 41 person,2001 12 person and 2007 12 person.These percentages and the years are very low fall category.
Non dependant children 1971 or 1981 10 person,2001 or 2007 9 person and the 1991 11 person available in this chart.
AI examiner evaluation
| Criterion | Band |
|---|---|
| Task Achievement / Task Response | 3.5 |
| Coherence and Cohesion | 4.0 |
| Lexical Resource | 4.5 |
| Grammatical Range and Accuracy | 4.5 |
| Overall | 4.0 |
Task Achievement / Task Response: Band 3.5
You identify several relevant categories and report many of their figures, including the rise in one-person households from 6% to 12% and the increase for couples without children from 19% to 25%. However, there is no clear overview of the main trends, and the response does not compare the categories in a meaningful way. Most importantly, the dependent-children figures for 2001 and 2007 are reported as 12%, whereas the table gives 39% and 36%; this also leads to the inaccurate claim that these percentages are very low. The response is 148 words, below the required 150, and eight copied words from the prompt are excluded from that count. Add a concise overview and check every figure against the table before writing your comparisons.
Coherence and Cohesion: Band 4.0
The response follows a broadly understandable order: it introduces the table, then reports figures for several household types. This gives the reader some sense of the information being covered. However, the opening repeats the same general point in two sentences, and the body reads mainly as a sequence of figures rather than a logically grouped summary. There are no clear paragraphs separating an overview from detailed comparisons, and links such as “Other” and “These percentages” do not clearly show how the ideas relate. Group the main trends in an overview, then organise the details by rising, falling, or relatively stable categories. Clearer paragraphing and more precise referencing would make the progression easier to follow.
Lexical Resource: Band 4.5
You use relevant basic terms such as “households,” “percentages,” “lone parent,” and “dependent children,” so the topic is generally recognisable. However, vocabulary is repetitive and several word combinations are inaccurate or unclear, including “the 1971 six person,” “each available person,” and “fall the high ratio.” The repeated use of “person” for percentage values also makes the data description imprecise. Aim to use standard chart language and accurate collocations, such as “accounted for,” “rose to,” and “fell from.” Check spelling and word forms as well: “house hold” should be “household,” and “dependant” is conventionally written “dependent” in this context.
Grammatical Range and Accuracy: Band 4.5
The response attempts some sentence variety, including a longer sentence that reports several years of data, but most sentences are simple lists and grammatical control is inconsistent. The opening, “The table below given shows the some information,” has problems with word order and articles, while “One person show” lacks subject–verb agreement. Several entries are fragments rather than complete sentences, and punctuation is often missing between figures and years, making the text harder to read. Use complete sentences with a clear subject and verb, for example, “The proportion of one-person households rose from 6% in 1971 to 12% in 2001.” Practise accurate articles, agreement, and punctuation while varying sentence structures.
See this exact question answered at other band scores. The same prompt compared across bands.
Browse more IELTS Writing model answers or get your own writing scored by the same AI examiner.