Band 5.0 IELTS Writing Task 1 Model Answer
Overall Band Score: 5.0 · IELTS Summit Mastery · 2026-11-20
IELTS Writing Task 1 question
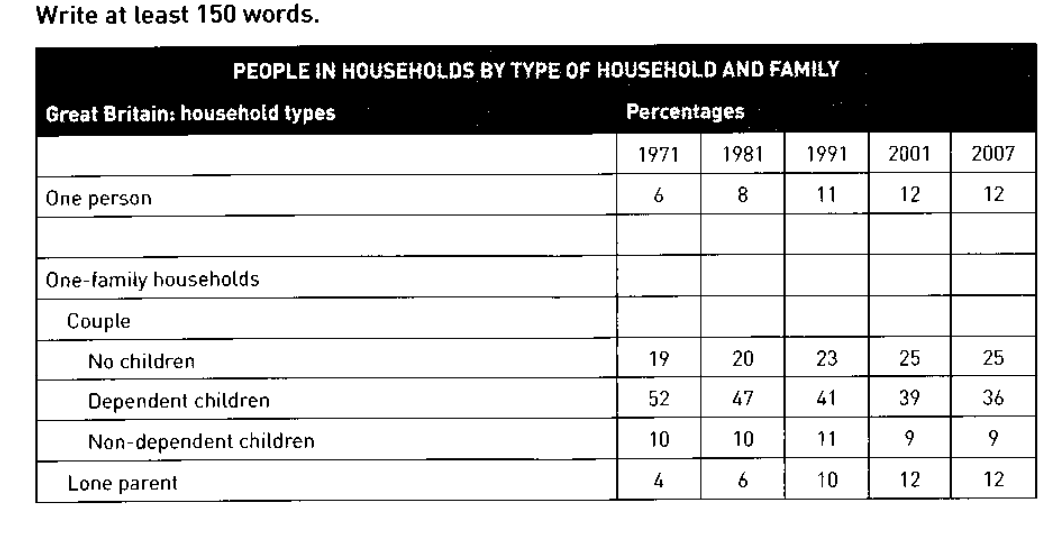
The table below shows the change in some household types in Great Britain from 1971 to 2007.
Summarise the information by selecting and reporting the main features, and make comparisons where relevant.
PEOPLE IN HOUSEHOLDS BY TYPE OF HOUSEHOLD AND FAMILY
Student answer (Band 5.0)
This table illustrates the change in some household types from 1971 to 2007 in Great Britain. I am presenting this data in three groups so that it would be easy to understand the change happened in some household types in Great Britain during a specific period.
Firstly, let's talk about the percentage of one person and the change during the whole period from 1971 to 2007, the highest percentage change was in the year of 2001 and 2007. Secondly , i would like to discuss the percentage change of one-family households, the couples having no children, their highest change was in 2001 and 2007. The couples having dependent children , their highest percentage change was in the year of 1971 and it gradually comes down in further years till 2007. Likewise, non-dependent children shows the same change, highest in the year of 1991. Lastly, the lone parents highest percentage change was in the year of 2001 and 2007 same as the one person percentage change.
AI examiner evaluation
| Criterion | Band |
|---|---|
| Task Achievement / Task Response | 4.0 |
| Coherence and Cohesion | 4.5 |
| Lexical Resource | 5.5 |
| Grammatical Range and Accuracy | 5.0 |
| Overall | 5.0 |
Task Achievement / Task Response: Band 4.0
You identify the topic and mention all five household categories, and you correctly note that households with dependent children declined while lone-parent households rose. However, the response does not give the actual percentages or clearly compare the scale of the changes. Several statements about the “highest percentage change” are unclear or inaccurate: one-person households reached their highest level in both 2001 and 2007, but this was 12%, while the no-children couple category also peaked at 25% in those years. Non-dependent children peaked in 1991, but the figures show only a small rise before falling. There is no clear overview of the main pattern across the table. Select the most important trends, report supporting figures, and distinguish a highest value from the size of a change.
Coherence and Cohesion: Band 4.5
The response has a basic sequence, moving from one-person households through the family categories to lone parents, and signposts such as “Firstly,” “Secondly,” and “Lastly” help show that sequence. However, the announced division into “three groups” is not clearly reflected in the organisation, and the whole response is presented as one paragraph. The repeated formula “highest percentage change” makes the progression feel list-like rather than comparative, while some references, such as “the same change,” are not sufficiently clear. Group the categories into paragraphs by shared trends—for example, rising categories and the declining dependent-children category—and use comparisons to connect the data rather than relying mainly on sequencing words.
Lexical Resource: Band 5.5
You use relevant topic vocabulary, including “household types,” “dependent children,” “non-dependent children,” and “lone parents,” so the reader can generally identify the categories being discussed. There is also some attempt to vary phrasing with “gradually comes down.” However, the wording is repetitive, especially the repeated use of “percentage change” and “highest,” and several expressions are imprecise for describing table data. “The couples having no children” is less concise than the category label, while “same change” does not specify the direction or size of the trend. Use precise reporting language such as “accounted for,” “rose to,” “declined from,” and “remained stable,” and reserve “change” for a difference between values.
Grammatical Range and Accuracy: Band 5.0
The response attempts some longer sentence forms, including clauses linked with “while” and “till,” but most sentences follow a simple, repetitive pattern. Errors in sentence construction and punctuation are frequent enough to make parts awkward to follow. For example, “the highest percentage change was in the year of 2001 and 2007” has an unclear singular/plural structure, and “the couples having dependent children, their highest percentage change” is not a complete, well-formed sentence. The phrase “it gradually comes down” also shifts into the present tense while describing past data. Practise forming complete sentences with a clear subject and verb, and use consistent past-tense reporting, such as “The proportion fell from 52% in 1971 to 36% in 2007.”
See this exact question answered at other band scores. The same prompt compared across bands.
Browse more IELTS Writing model answers or get your own writing scored by the same AI examiner.