Band 5.5 IELTS Writing Task 1 Model Answer
Overall Band Score: 5.5 · IELTS Summit Mastery · 2026-11-21
IELTS Writing Task 1 question
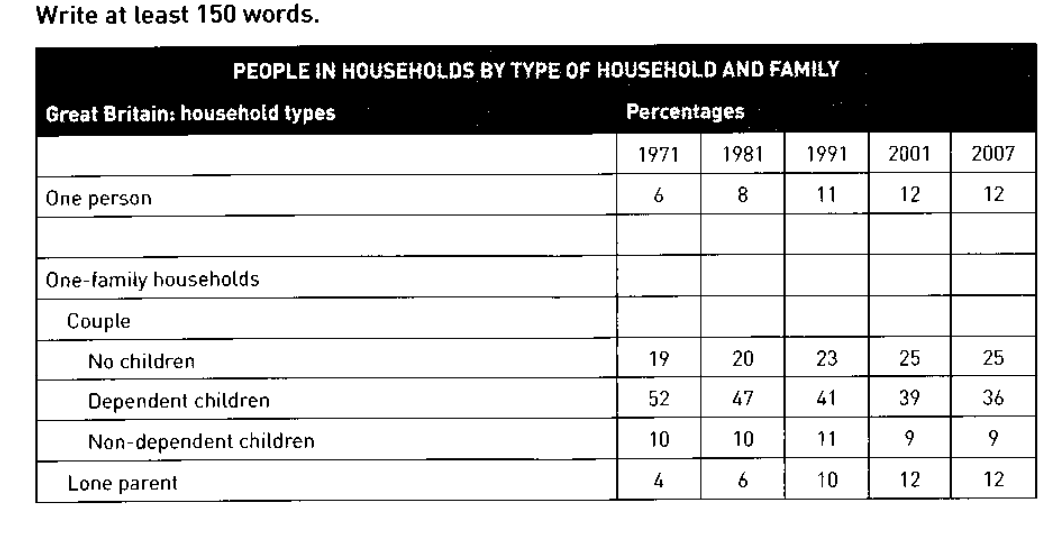
The table below shows the change in some household types in Great Britain from 1971 to 2007.
Summarise the information by selecting and reporting the main features, and make comparisons where relevant.
PEOPLE IN HOUSEHOLDS BY TYPE OF HOUSEHOLD AND FAMILY
Student answer (Band 5.5)
The table illustrates the changes in percentage of people across different household types in Green Britain in between 1971 and 2007.
Overall, the table consists of 7 household types. Dependent Children seems dominant in household over four decade. Two household namely Couple and No children show no contribution.
In 1971, Dependent Children family was the largest contributor with 52 percentages. Secondly, Family with no children was in second position with 19 percentage, followed by non-dependent children and one person family with 10 and 6 % respectively. Lone parent family was the smallest contributor with just 4%.
Over the four decades, Even Depandent children family viewed the gradual decrease in its percentage, but it still hold the majority position. All other families, increased consistently except non-dependent children family which declined steadily. By final year 2007, dependent children family is highest contributor with 36% even declining in percentage followed by no children family accounting 25%, and one person and lone parent family each accounting 12%. Non-dependent children family contributes the smappest portion just 9% by 2007
AI examiner evaluation
| Criterion | Band |
|---|---|
| Task Achievement / Task Response | 5.5 |
| Coherence and Cohesion | 6.0 |
| Lexical Resource | 5.5 |
| Grammatical Range and Accuracy | 5.5 |
| Overall | 5.5 |
Task Achievement / Task Response: Band 5.5
You identify the main pattern: households with dependent children remain the largest category while their share falls, and you report several accurate figures, including 52% in 1971 and 36% in 2007. You also note the rise in one-person and lone-parent households. However, the overview is unclear and includes a major misreading: “Couple and No children show no contribution,” although couples without children account for 19% to 25%. The table has five listed categories, not seven. Some trend descriptions are also too broad: non-dependent children fluctuate before falling, rather than declining steadily, and one-person and lone-parent shares do not increase consistently in every interval. Select the key comparisons accurately and make the overview more precise.
Coherence and Cohesion: Band 6.0
The response has a recognisable structure, moving from an introduction and overview to details for 1971 and 2007, with a paragraph describing changes over time. This gives the reader a coherent overall route through the information. However, the overview’s claim that two household types make “no contribution” conflicts with the later figures, disrupting the progression. Some linking is mechanical, such as “Secondly,” “followed by,” and repeated use of “Over the four decades.” The final paragraph also combines several trends and endpoint comparisons in a long sequence, making relationships between categories less clear. Grouping the rising categories together and contrasting them with the declining dependent-children category would improve cohesion and make comparisons easier to follow.
Lexical Resource: Band 5.5
You use a reasonable range of task-related vocabulary, including “gradual decrease,” “majority position,” “accounting,” and “portion,” and the reader can generally understand the intended comparisons. However, several inaccurate or awkward choices reduce precision: “contributors” suggests that household types contribute to something, while “no contribution” misrepresents the data. There are also noticeable spelling errors, including “Depandent” and “smappest,” and the phrase “Green Britain” is an inaccurate name for Great Britain. Repetition of “family” and “percentage” limits flexibility. Choose standard terms such as “category” and “share,” and check spelling and collocations so that vocabulary supports accurate reporting.
Grammatical Range and Accuracy: Band 5.5
You attempt both simple and more complex sentence forms, including a contrast with “even declining in percentage” and a sentence describing several categories together. Meaning is usually recoverable, but errors in sentence construction and grammatical forms are noticeable. For example, “Dependent Children seems dominant” has a subject–verb agreement problem, while “it still hold” uses the wrong verb form. “In between 1971 and 2007” is an awkward prepositional construction, and “with 52 percentages” shows inaccurate number marking. The sentence beginning “All other families, increased consistently” also has faulty punctuation and an inaccurate grammatical relationship. Use complete, controlled sentences, check agreement and tense, and punctuate introductory phrases carefully.
See this exact question answered at other band scores. The same prompt compared across bands.
Browse more IELTS Writing model answers or get your own writing scored by the same AI examiner.