Band 5.0 IELTS Writing Task 1 Model Answer
Overall Band Score: 5.0 · IELTS Summit Mastery · 2026-11-04
IELTS Writing Task 1 question
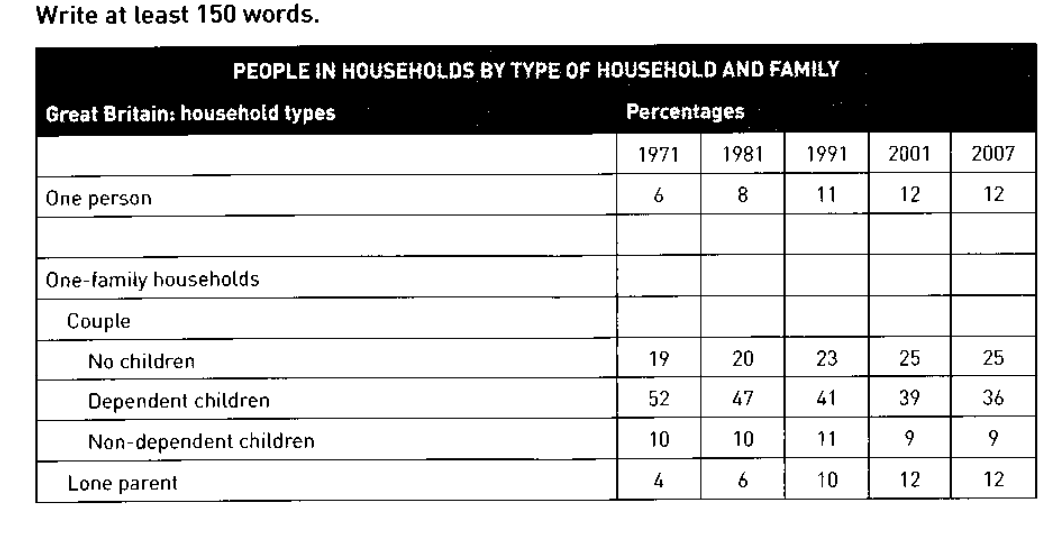
The table below shows the change in some household types in Great Britain from 1971 to 2007.
Summarise the information by selecting and reporting the main features, and make comparisons where relevant.
PEOPLE IN HOUSEHOLDS BY TYPE OF HOUSEHOLD AND FAMILY
Student answer (Band 5.0)
The table shows to people live in household by type of household and family deffrant years 1971, 1981, 1991, 2001 and 2007
Overal, this table shoes family like one person, couple with children, copule without children and lone perent
the 1971 in heast live in 52 pescentages people are couple with childern and same years but 4 percentages is lowest are lone parent.
one person parcentages are alsho ingrishing like year way like 1971 in 6%, 1981 in 8%, 1991 in 11%, 2001 and 2007 are same percentages 12%.
Dependent children are all tile is decreges percentages like 1971 in 52%, 1981 in 47%, 1991 in 41%, 2001 in 39%, 2007 in 36%.
No children and Lone parent are both of parcentages are ingrishing like 19 down to 25 up and 4 down to 12 up.
Non-dependent children paracentages are decrisgis like 10 to 9
AI examiner evaluation
| Criterion | Band |
|---|---|
| Task Achievement / Task Response | 5.0 |
| Coherence and Cohesion | 5.0 |
| Lexical Resource | 4.5 |
| Grammatical Range and Accuracy | 4.5 |
| Overall | 5.0 |
Task Achievement / Task Response: Band 5.0
You identify the table’s subject and report several accurate trends, including the rise in one-person households from 6% to 12% and the fall in households with dependent children from 52% to 36%. However, the response only partially summarises the main features: it gives no clear overview of the most significant overall pattern, and the comparison that “No children and Lone parent” both increase is not supported with precise figures across the years. Some categories are also described unclearly, so the reader cannot always tell which household type is being discussed. The response is five words below the required minimum. To strengthen the report, add a concise overview and compare the largest and smallest categories using accurate, clearly attributed data.
Coherence and Cohesion: Band 5.0
There is some organisation: the response begins by introducing the table, then mentions household categories and gives details about several trends. The figures for one-person households and dependent children are presented in chronological order, which helps the reader follow those changes. However, there is no clear overall progression, and the ideas are compressed into one block rather than separated into a clear introduction, overview and detail paragraphs. Linking is also limited; phrases such as “like year way” and “both of percentages” do not clearly show how the comparisons relate. Use paragraphing and organise the details into groups—for example, rising categories and declining categories—while using straightforward links such as “by contrast” and “over the period.”
Lexical Resource: Band 4.5
The response uses some relevant task vocabulary, including “household,” “dependent children,” “lone parent” and “percentages,” so the topic is generally recognisable. However, the range is limited and many spelling and word-choice errors make the report difficult to read, such as “deffrant,” “ingrishing,” “decreges” and “decrisgis.” Some phrases are also not natural or precise, including “people live in household” and “the 1971 in heast.” These problems sometimes make it hard to identify the intended trend or category. Build a reliable set of terms for describing proportions and change, and check spelling and collocations carefully; for example, use “increased,” “decreased,” and “the highest proportion.”
Grammatical Range and Accuracy: Band 4.5
You attempt to communicate several comparisons using simple sentences and lists of figures, but the grammatical range is limited and errors occur frequently. The opening, “The table shows to people live in household,” lacks a workable sentence structure, while “one person parcentages are alsho ingrishing” has problems with the verb pattern and sentence construction. Articles, plurals and prepositions are also often missing or inaccurate, as in “in 6%” and “4 percentages is lowest.” These errors can make relationships between the figures unclear. Practise accurate basic patterns such as “The proportion of one-person households rose from 6% to 12%” and “The figure for dependent children fell,” then use these consistently before attempting longer sentences.
See this exact question answered at other band scores. The same prompt compared across bands.
Browse more IELTS Writing model answers or get your own writing scored by the same AI examiner.